
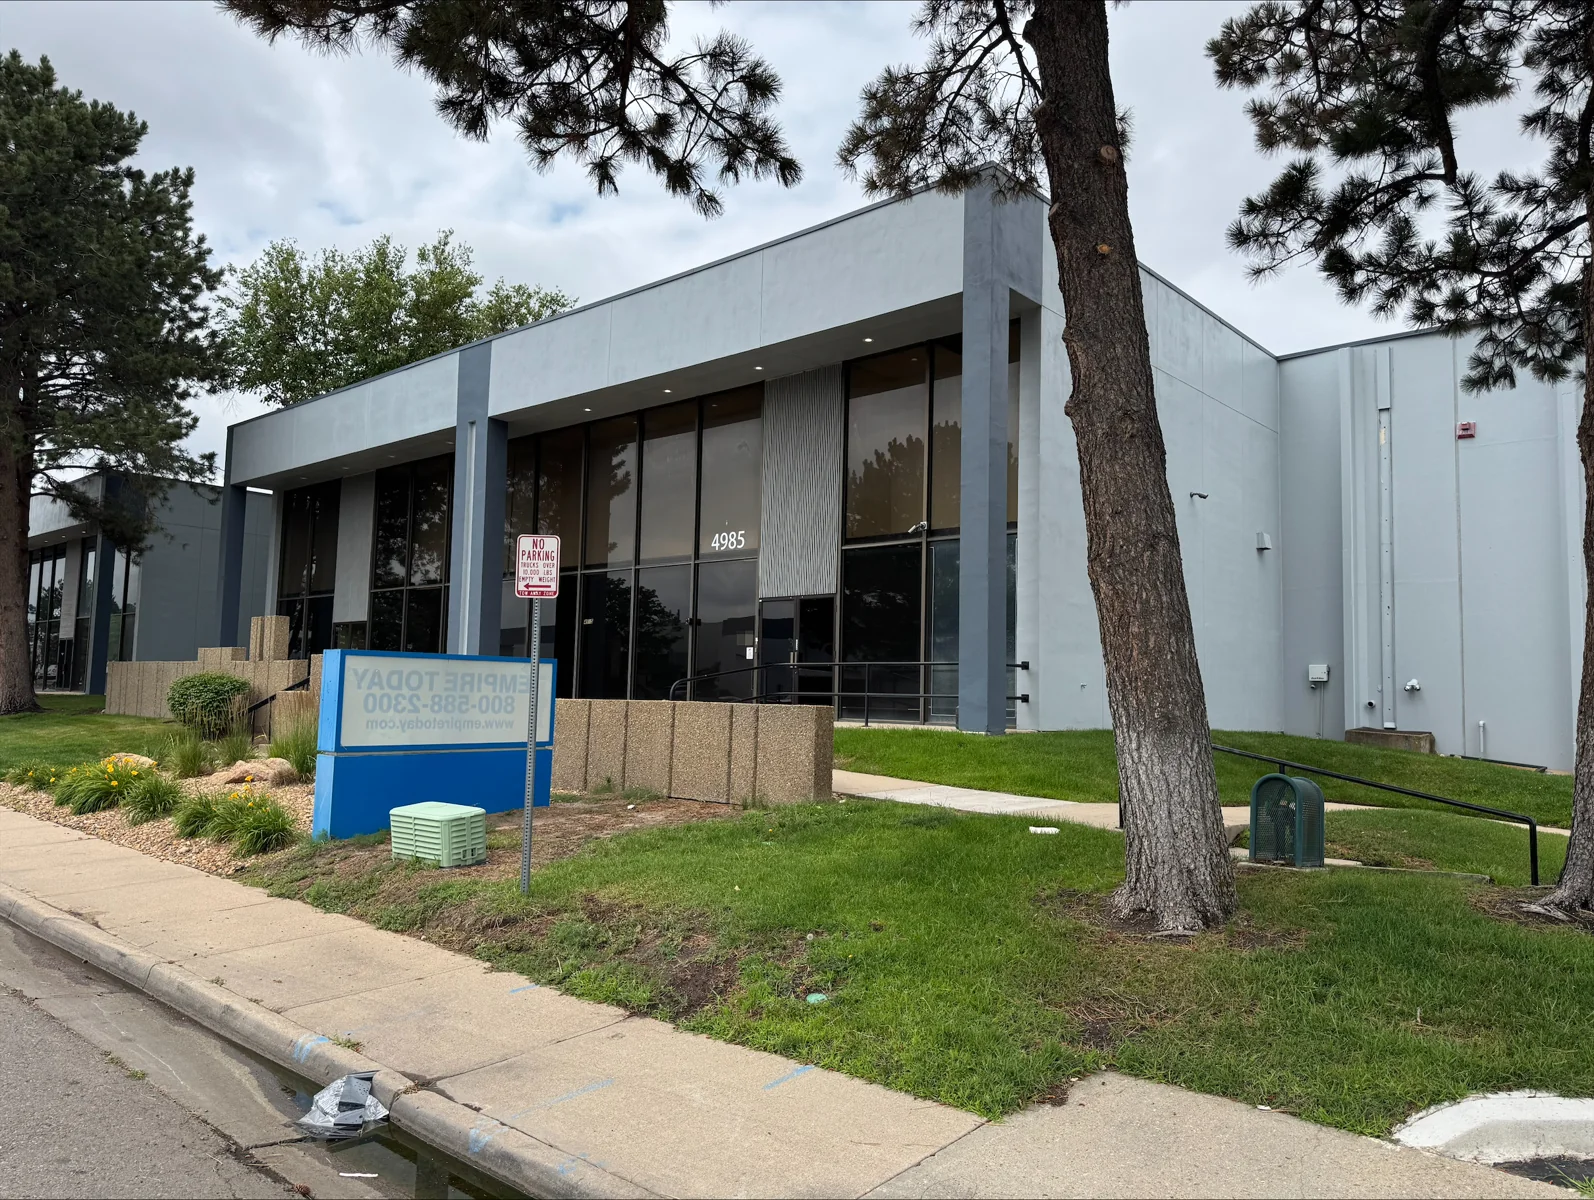
Arapahoe Corporate Park
Price
Price on request
Price/Sq Ft
$6.67
Description
Units 6, 7 & 40 for Sublease
Property description as provided by the listing source. PropZone adds independent market context, valuation estimates, and comparable listings.


Financial Details
Market Context
As of Q1 2026, the Denver industrial market showed a 9.1% vacancy rate, average asking rents near $9.76/SF/yr, rents up 8.2% year over year, and cap rates around 7.5%. Source: multiple brokerages Q1 2026 market report.
Projected current pricing
high confidenceModeled estimate (income approach) shown as a range — not an appraisal. Projected asking rent × occupancy × net-operating-income margin band ÷ market cap rate, from Q1 2026 multiple brokerages data (cap rate 7.5%, asking rent trend-adjusted to today).
Rising rents point to a competitive market where well-priced, well-located space leases quickly.
Compare it against other industrial listings for lease in Centennial, CO to benchmark pricing and space — view the full market.
Industrial market FAQ
- What is the typical cap rate for industrial in Denver?
- About 7.5% as of Q1 2026, per multiple brokerages.
- Is the Denver industrial market tightening or softening?
- Vacancy is around 9.1%, with asking rents rising year over year (Q1 2026).
Unified Estimate
Very Low ConfidenceRate-first confidence-weighted blend with cost-of-business adjustment.
No local comparable sales were available, so this estimate is transferred from a comparable peer market — treat it as a rough indication only. Transferred from peer market san-antonio (similarity: 92%) with 9 comparable listings.
Lease Rate & Market Trend
2023 – 2026 · county sold comps + market trendsFIPS 08005
- Avg Rent ($/SF/mo) (market data)
- Median $/SF (sold)
- Vacancy %
Investment Analysis
Beta Feature: Investment Analysis is currently in beta testing. Metrics are calculated based on available financial data and market comparables. Results are for informational purposes and should not be considered financial advice. Verify all assumptions and consult with a financial advisor before making investment decisions.
Insufficient financial data for full analysis. Add more financial fields to improve metric coverage.
Market Employment Trend
December 2025 • Source: BLS QCEW
Economic Indicators
Source: FRED
Market Demographics
Census ACS 20242024 American Community Survey 5-Year Estimates •Released annually by U.S. Census Bureau
Sold Comps
Q2 2026Source: denver_assessor_co · County FIPS: 08031
Assumptions
- Market comparison: industrial in centennial, CO
More Industrial for Lease in Centennial, CO(5)
4985 Lima St
denver, CO
Price on request
Cap Rate
N/A
Price/SF
4.0/sf
SF
N/A

Upland Distribution Park
aurora, CO
Price on request
Cap Rate
N/A
Price/SF
N/A
SF
102.0K

Upland Distribution Park
Aurora, CO
Price on request
Cap Rate
N/A
Price/SF
N/A
SF
102.0K

Aero 70 Logistics Park
aurora, CO
Price on request
Cap Rate
N/A
Price/SF
N/A
SF
N/A

Upland Industrial Park
aurora, CO
Price on request
Cap Rate
N/A
Price/SF
N/A
SF
70.1K