Third & Traction
Price
Price on request
Price/Sq Ft
$5.45
Description
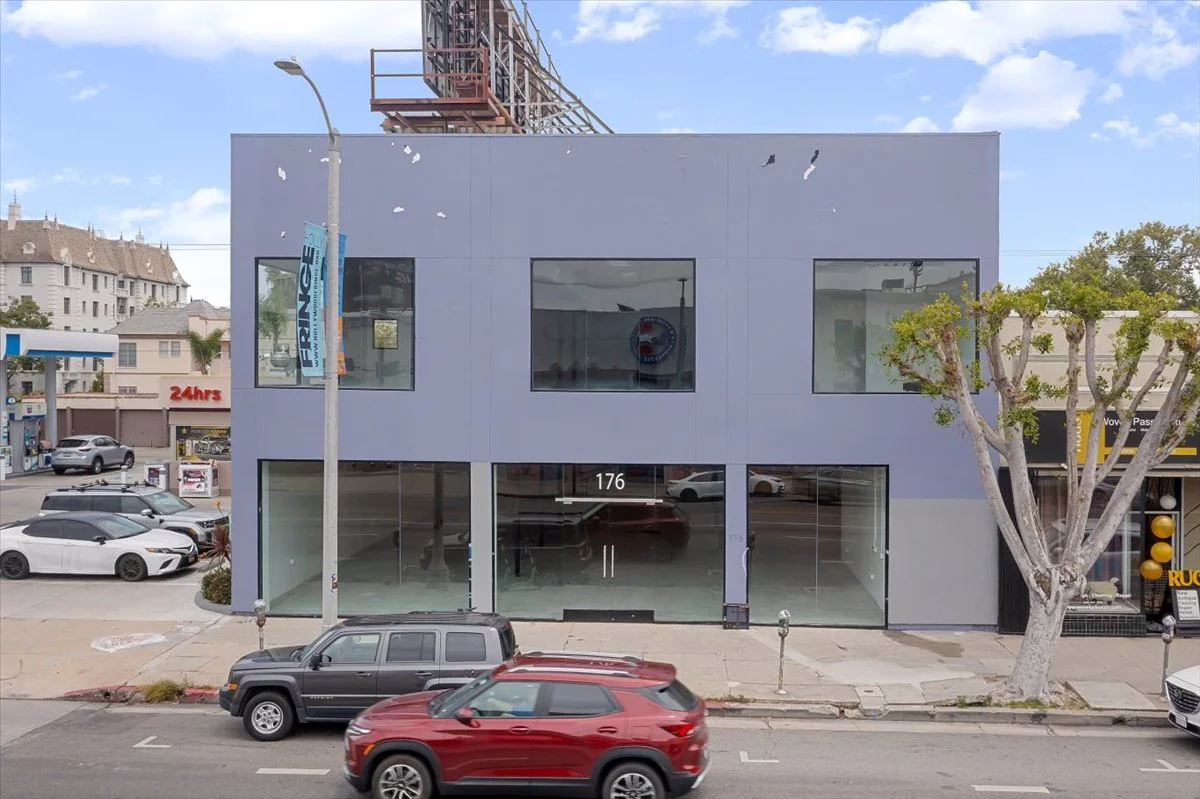
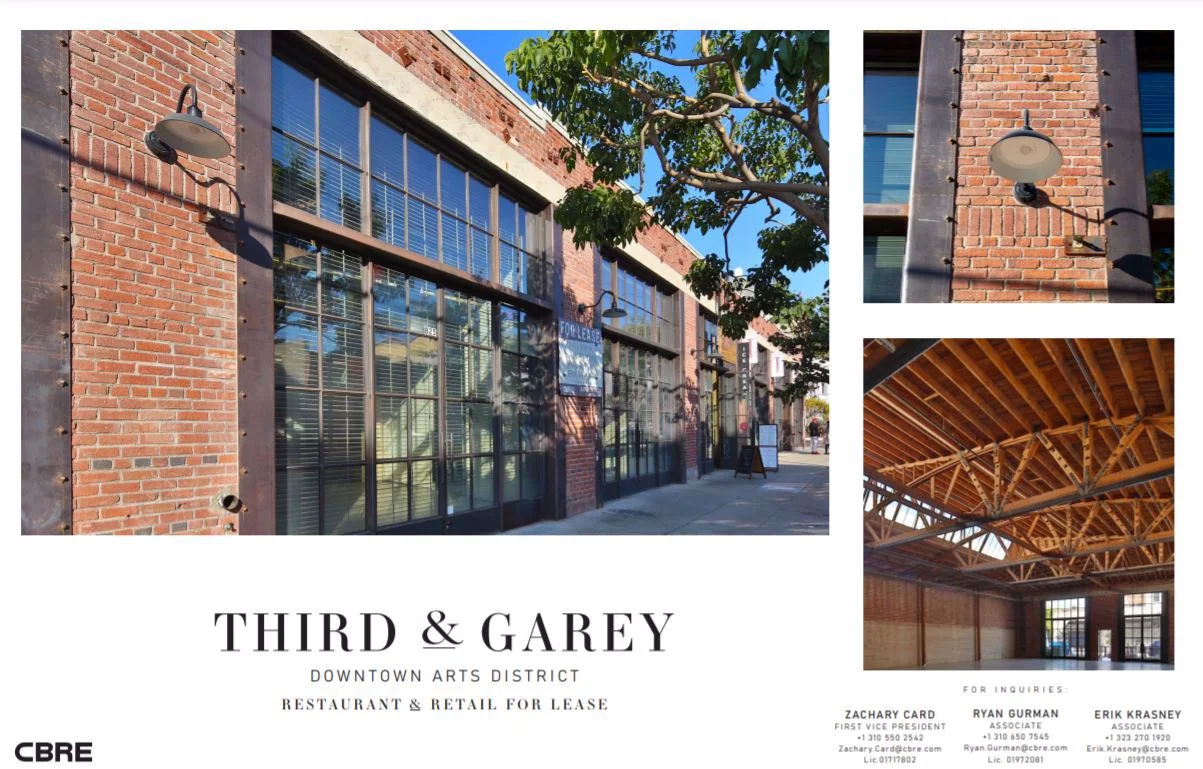
- •Third & Traction
- •Located in the heart of the Arts District
- •Exposed concrete
- •Large open ceiling/open plan units
- •Large windows with an abundance of natural light
- •Retail and restaurant options onsite
- •Two units per floor
- •Individual HVAC for each unit
- •High level air filtration system
- •Separate office and retail entrances
- •“Work/Live” Permitted
Property description as provided by the listing source. PropZone adds independent market context, valuation estimates, and comparable listings.


Financial Details
Market Context
As of Q3 2023, the Greater Los Angeles retail market showed rents up 0.5% year over year, and cap rates around 5.0%. Source: multiple brokerages Q3 2023 market report.
Projected current pricing
low confidenceModeled estimate (income approach) shown as a range — not an appraisal. Projected asking rent × occupancy × net-operating-income margin band ÷ market cap rate, from Q4 2025 www matthews com data (cap rate 7.2%, asking rent trend-adjusted to today).
Compare it against other retail listings for lease in Los Angeles, CA to benchmark pricing and space — view the full market.
Retail market FAQ
- What is the typical cap rate for retail in Greater Los Angeles?
- About 5.0% as of Q3 2023, per multiple brokerages.
Unified Estimate
Medium ConfidenceRate-first confidence-weighted blend with cost-of-business adjustment.
Lease Rate & Market Trend
2000 – 2025 · county sold comps + market trendsFIPS 06037
- Median $/SF (sold)
Investment Analysis
Beta Feature: Investment Analysis is currently in beta testing. Metrics are calculated based on available financial data and market comparables. Results are for informational purposes and should not be considered financial advice. Verify all assumptions and consult with a financial advisor before making investment decisions.
Market Employment Trend
December 2025 • Source: BLS QCEW
Economic Indicators
Source: FRED
Market Demographics
Census ACS 20242024 American Community Survey 5-Year Estimates •Released annually by U.S. Census Bureau
Sold Comps
Q1 2026Source: los_angeles_assessor · County FIPS: 06037
Rent vs. Market
$5.45
25.2% below market average
Listed at $5.45/sqft/mo vs. market avg $7.29/sqft/mo
Assumptions
- Market comparison: retail in los angeles, CA
More Retail for Lease in Los Angeles, CA(5)
Property in Unknown, XX
Los Angeles, CA
$5.00M
Cap Rate
N/A
Price/SF
5.0/sf
SF
N/A
821-835 E 3rd St.
los angeles, CA
Price on request
Cap Rate
N/A
Price/SF
5.5/sf
SF
N/A

Retail in Los Angeles, CA
los angeles, CA
Price on request
Cap Rate
N/A
Price/SF
4.5/sf
SF
N/A

1241-1245 3rd St
santa monica, CA
Price on request
Cap Rate
N/A
Price/SF
6.0/sf
SF
N/A

1247 3rd St
santa monica, CA
Price on request
Cap Rate
N/A
Price/SF
6.0/sf
SF
N/A