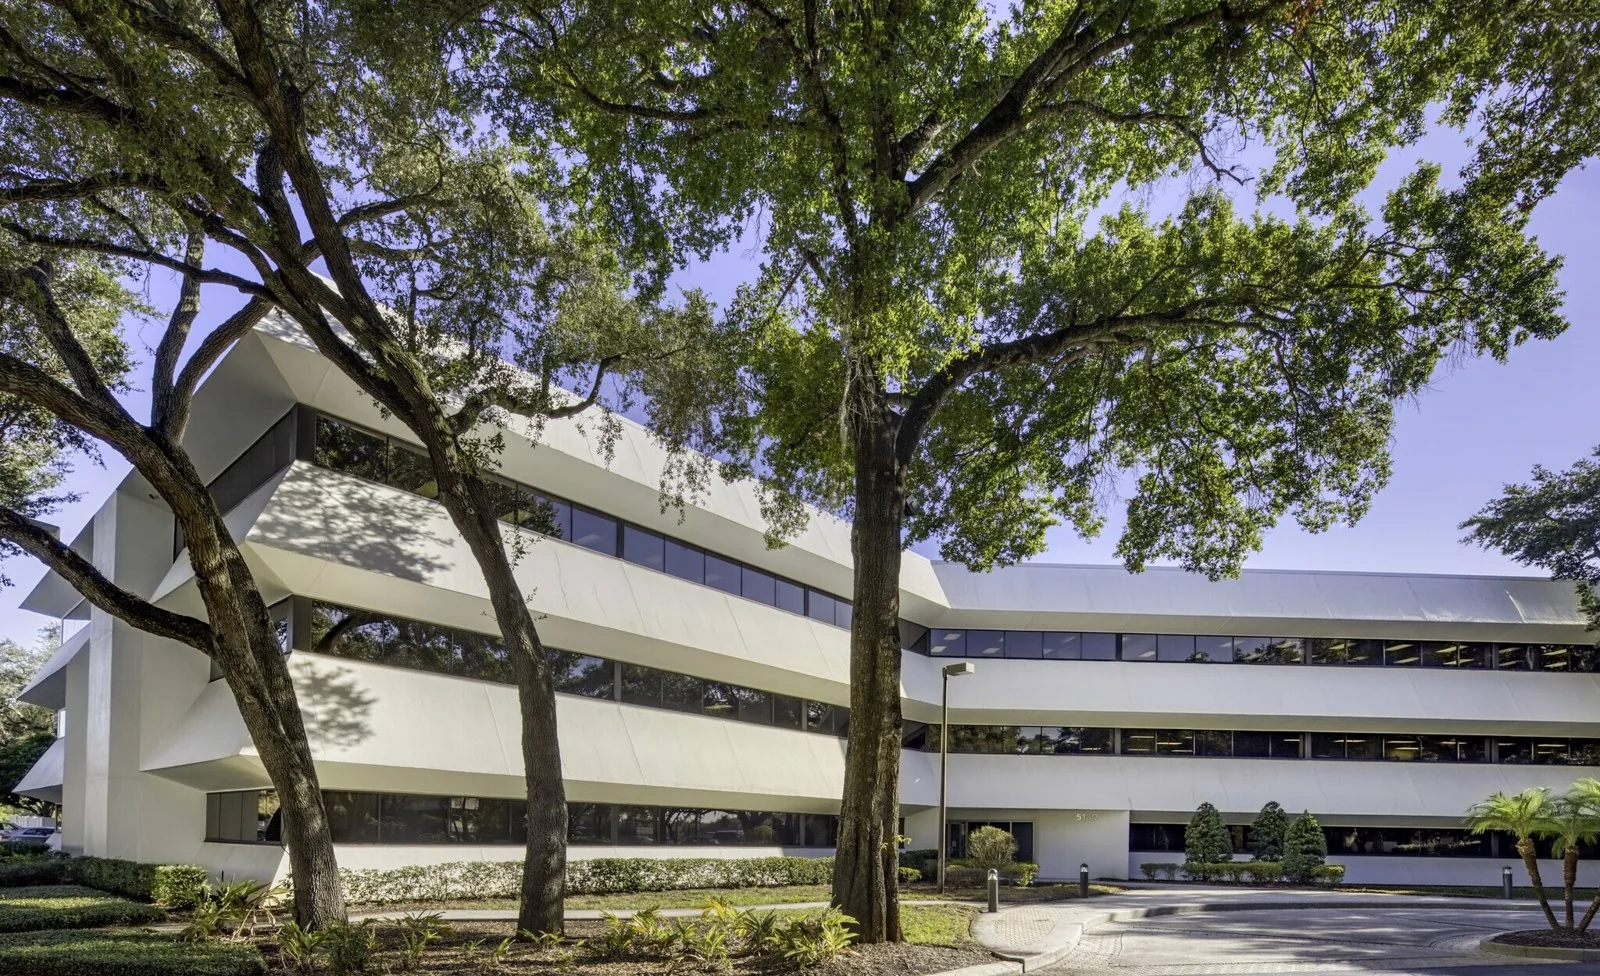
Sunforest I
Price
Price on request
Market rate estimate — not broker-provided
Cost-of-Business Details
Medium ConfidenceEstimated from market cap rate (7.4%), property tax rate (0.01%), and NYC PLUTO (6,250 parcels, assessed $/SF = 110).
| Component | Value | Detail | Source |
|---|---|---|---|
| Base Rent | $2.32/SF/mo | — | tax_cap_reverse |
| Utilities | — | 4.9¢/kWh | OpenEI URDB |
| Property Tax | — | 0.0% eff. rate | API Ninjas |
| Labor Index | — | $1440/wk | BLS QCEW |
Source Provenance (3)
| Source | Type | Count | Year | Freshness | Peer |
|---|---|---|---|---|---|
| Market Reports | cap_rate | — | — | quarterly | — |
| API Ninjas | property_tax | — | — | annual | — |
| NYC PLUTO | assessed_value_psf | — | — | annual | — |
Description
FIRE SALE! 12,169 SF Available + 12,169 RSF + Lease Expiration - 4/30/2025 + 26 Offices + 22 Cubicles + Large and small conference rooms
Property description as provided by the listing source. PropZone adds independent market context, valuation estimates, and comparable listings.


Financial Details
Market Context
As of Q1 2026, the Tampa office market showed a 18.2% vacancy rate, average asking rents near $29.00/SF/yr, and cap rates around 7.4%. Source: curated:survey Q1 2026 market report.
Projected current pricing
low confidenceModeled estimate (income approach) shown as a range — not an appraisal. Projected asking rent × occupancy × net-operating-income margin band ÷ market cap rate, from Q1 2026 Cushman & Wakefield data (cap rate 7.4%, asking rent trend-adjusted to today).
Above-average vacancy gives tenants leverage and a wide set of comparables.
Compare it against other office listings for lease in Tampa, FL to benchmark pricing and space — view the full market.
Office market FAQ
- What is the typical cap rate for office in Tampa?
- About 7.4% as of Q1 2026, per curated:survey.
- Is the Tampa office market tightening or softening?
- Vacancy is around 18.2% (Q1 2026).
Unified Estimate
Medium ConfidenceRate-first confidence-weighted blend with cost-of-business adjustment.
Lease Rate & Market Trend
Market report quarterly trend fallback
- Avg Rent ($/SF/mo) (market data)
- Vacancy %
Investment Analysis
Beta Feature: Investment Analysis is currently in beta testing. Metrics are calculated based on available financial data and market comparables. Results are for informational purposes and should not be considered financial advice. Verify all assumptions and consult with a financial advisor before making investment decisions.
Insufficient financial data for full analysis. Add more financial fields to improve metric coverage.
Market Employment Trend
December 2025 • Source: BLS QCEW
Economic Indicators
Source: FRED
Market Demographics
Census ACS 20242024 American Community Survey 5-Year Estimates •Released annually by U.S. Census Bureau
Sold Comps
Q3 2025Source: florida_dor · County FIPS: 12057
Assumptions
- Market comparison: office in tampa, FL
More Office for Lease in Tampa, FL(5)

Tampa International Business Center - C
Tampa, FL
Price on request
Cap Rate
N/A
Price/SF
N/A
SF
35.2K
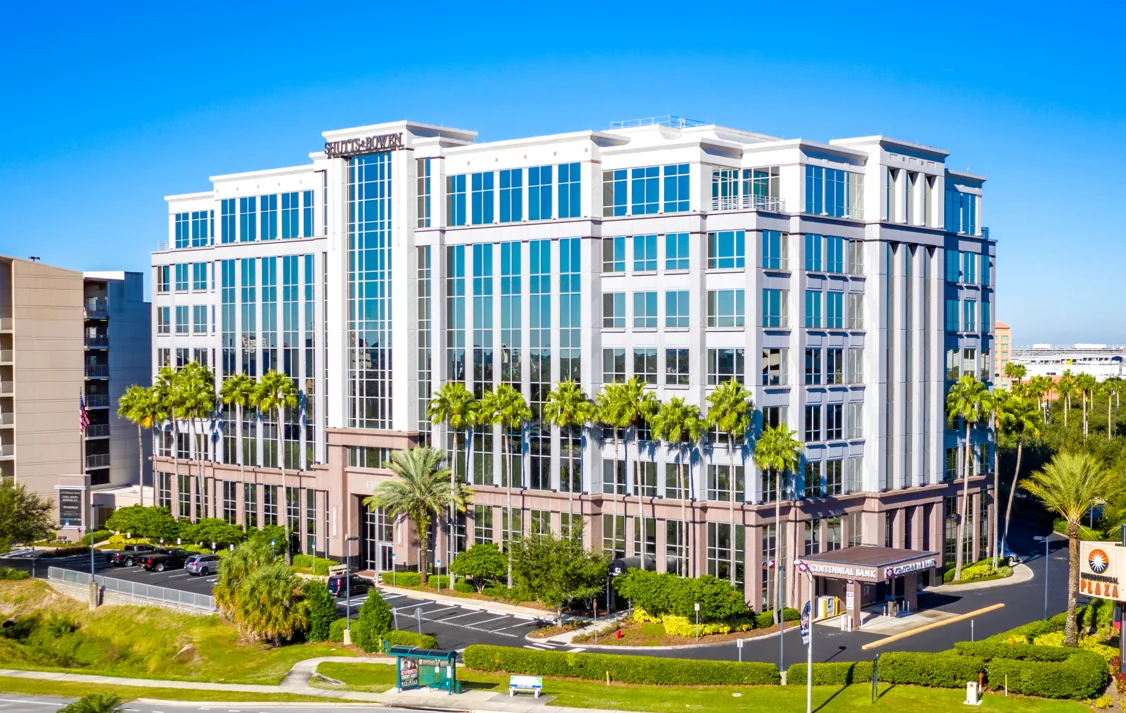
Atrium
Tampa, FL
Price on request
Cap Rate
N/A
Price/SF
N/A
SF
135.1K
Office in Tampa, FL
tampa, FL
Price on request
Cap Rate
N/A
Price/SF
N/A
SF
N/A
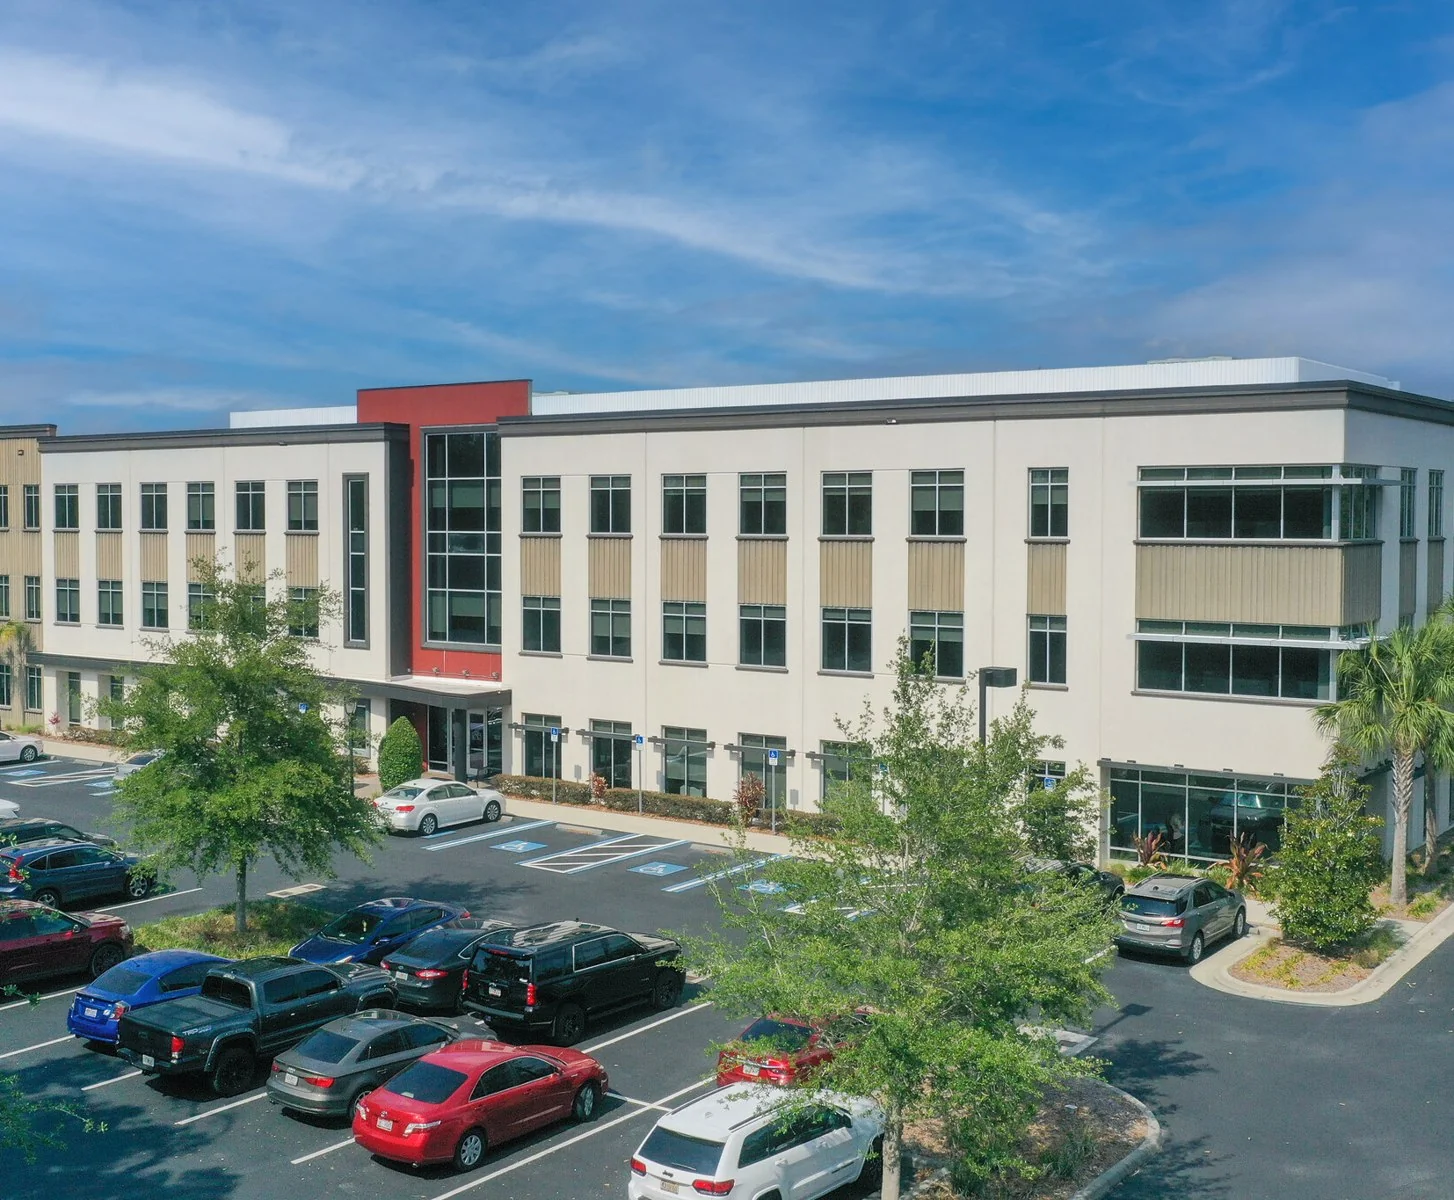
Corporate Center IV
tampa, FL
Price on request
Cap Rate
N/A
Price/SF
N/A
SF
N/A
Office in Tampa, FL
tampa, FL
Price on request
Cap Rate
N/A
Price/SF
33.0/sf
SF
N/A