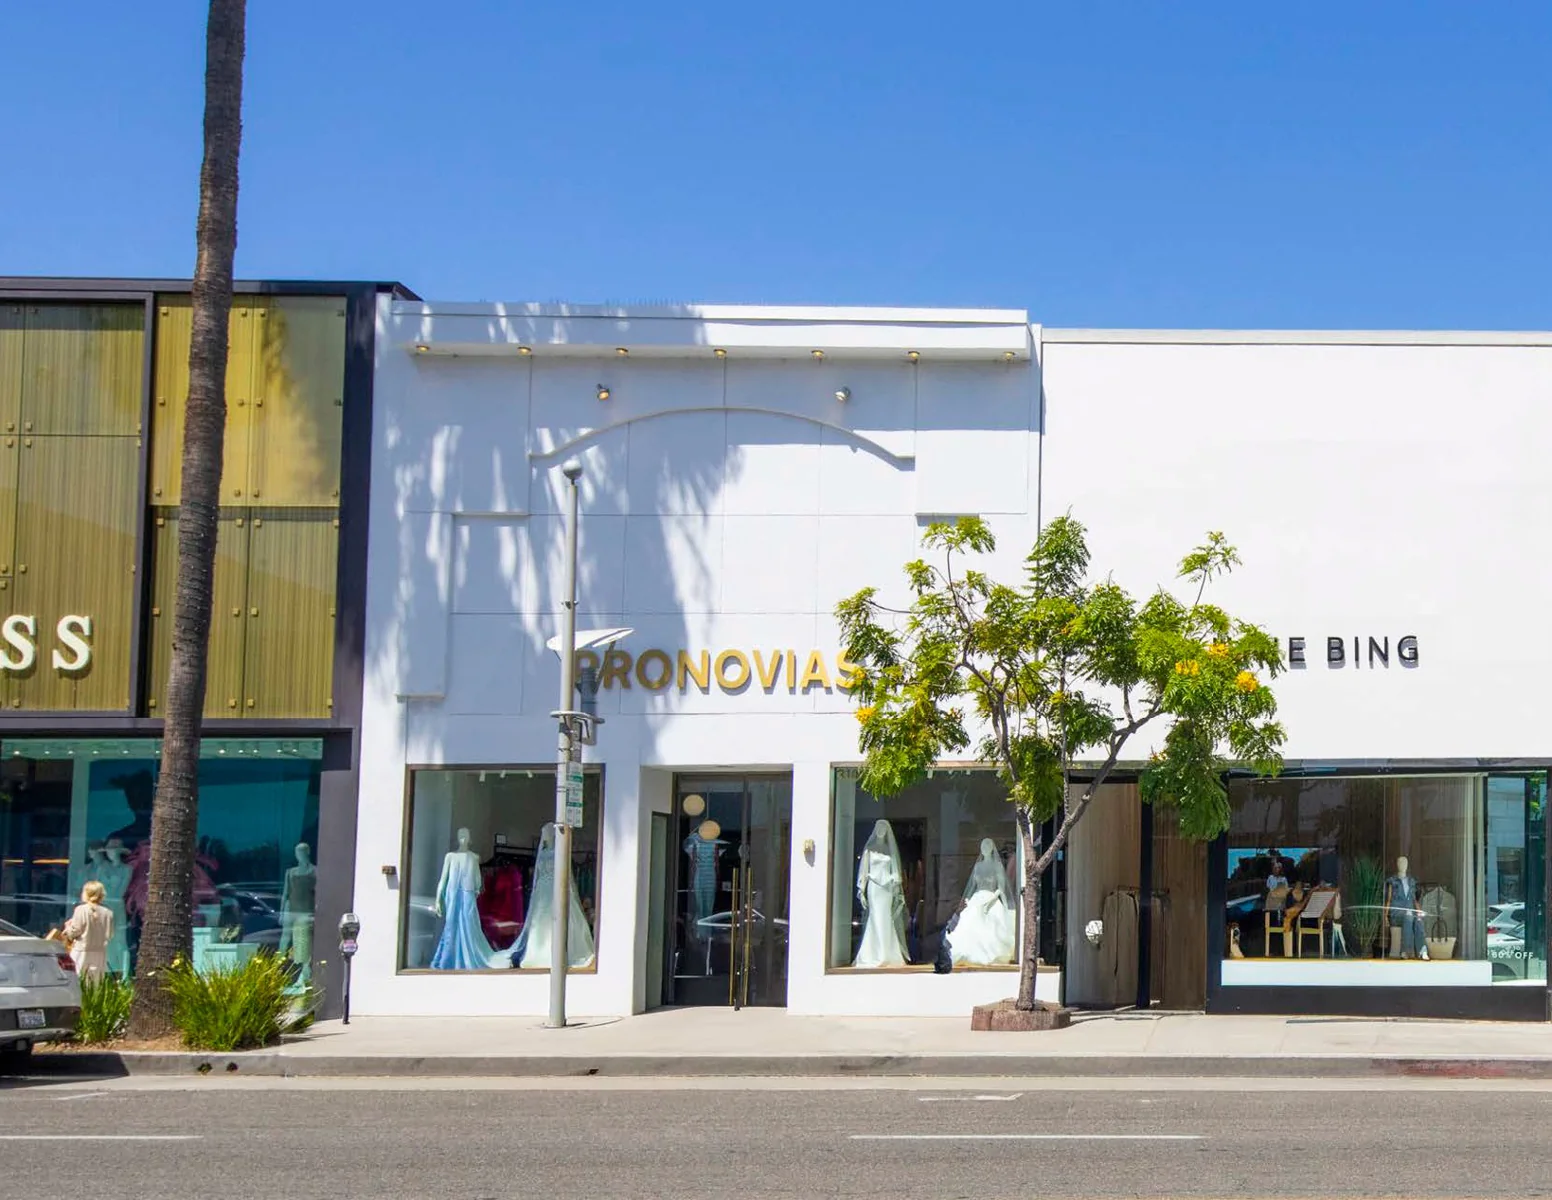
Retail in Beverly Hills, CA
Price
Price on request
Market rate estimate — not broker-provided
Cost-of-Business Details
Medium ConfidenceEstimated from market cap rate (7.2%), property tax rate (0.01%), and wage-adjusted baseline.
| Component | Value | Detail | Source |
|---|---|---|---|
| Base Rent | $25.99/SF | — | tax_cap_reverse |
| Utilities | — | 2.6¢/kWh | OpenEI URDB |
| Property Tax | — | 0.0% eff. rate | API Ninjas |
| Labor Index | — | $1516/wk | BLS QCEW |
Source Provenance (3)
| Source | Type | Count | Year | Freshness | Peer |
|---|---|---|---|---|---|
| Market Reports | cap_rate | — | — | quarterly | — |
| API Ninjas | property_tax | — | — | annual | — |
| BLS QCEW | wage_index | — | — | quarterly | — |
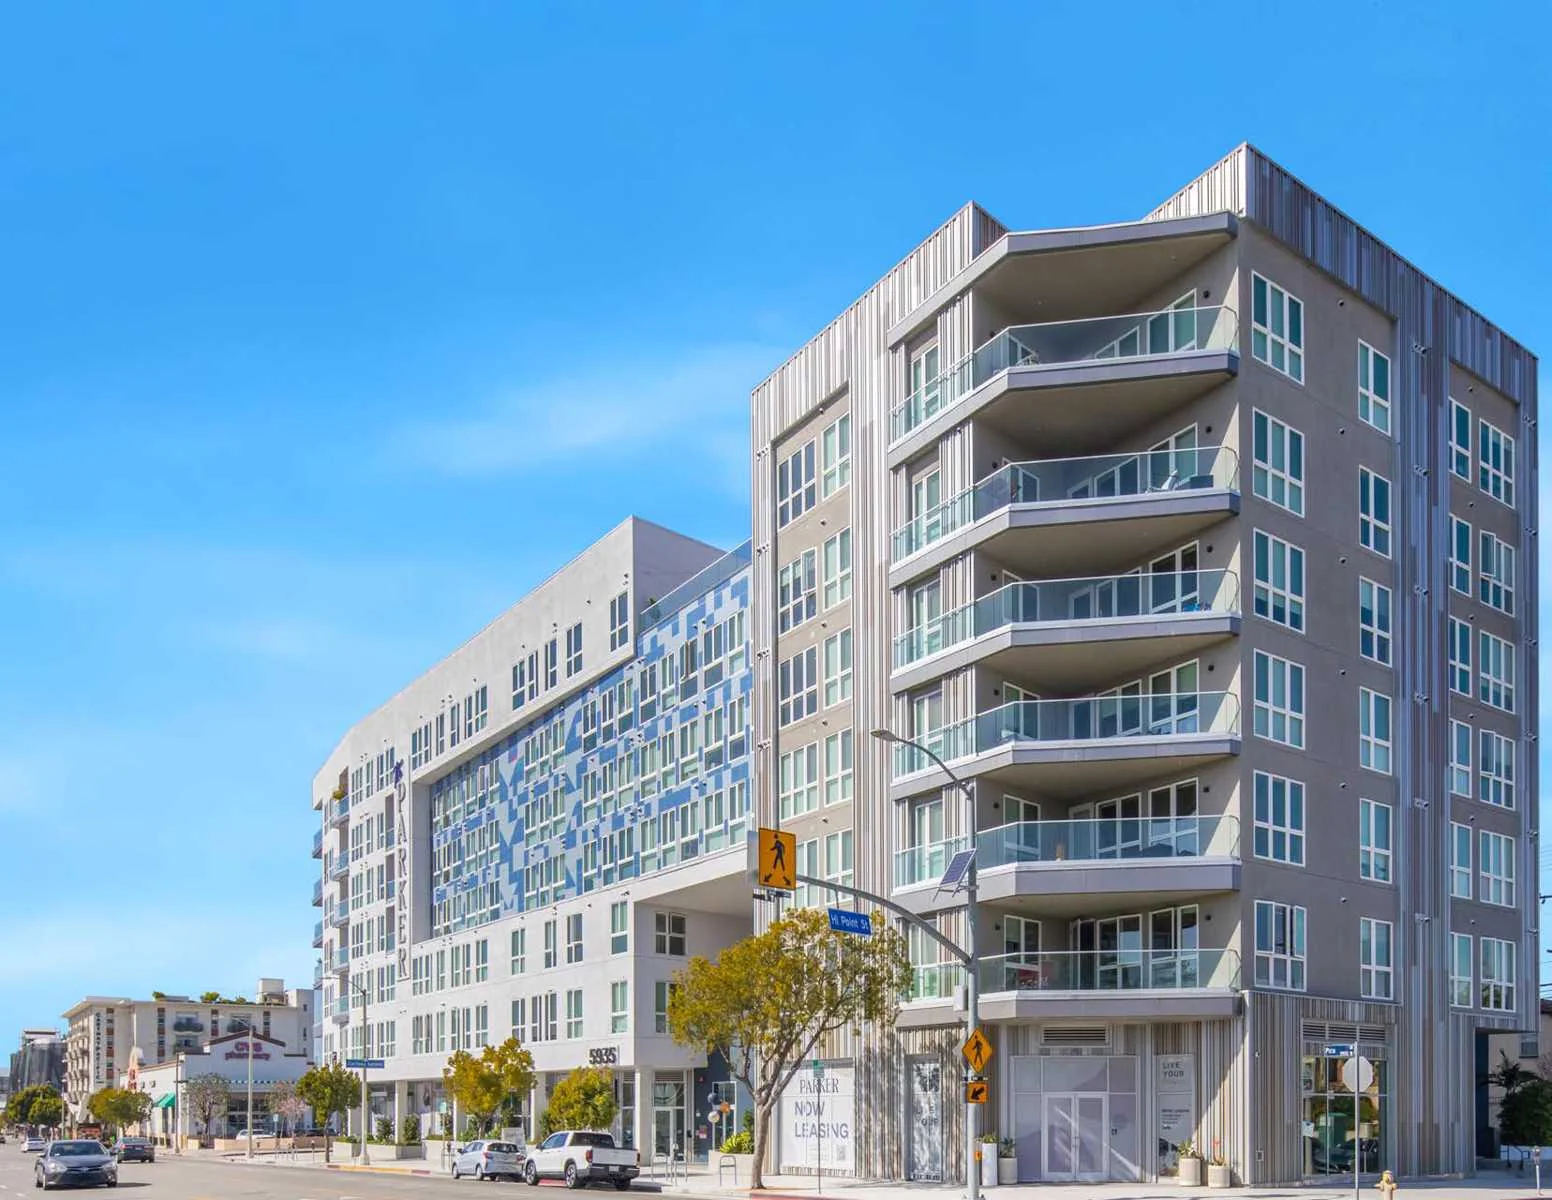
Description
Retail in Beverly Hills, CA
Property description as provided by the listing source. PropZone adds independent market context, valuation estimates, and comparable listings.


Market Context
As of Q3 2023, the Greater Los Angeles retail market showed rents up 0.5% year over year, and cap rates around 5.0%. Source: multiple brokerages Q3 2023 market report.
Projected current pricing
low confidenceModeled estimate (income approach) shown as a range — not an appraisal. Projected asking rent × occupancy × net-operating-income margin band ÷ market cap rate, from Q4 2025 www matthews com data (cap rate 7.2%, asking rent trend-adjusted to today).
Compare it against other retail listings for sale in Beverly Hills, CA to benchmark pricing and space — view the full market.
Retail market FAQ
- What is the typical cap rate for retail in Greater Los Angeles?
- About 5.0% as of Q3 2023, per multiple brokerages.
Unified Estimate
Medium ConfidenceRate-first confidence-weighted blend with cost-of-business adjustment.
Sale Price History
2000 – 2025 · county sold comps + market trendsFIPS 06037
- Median $/SF (sold)
Investment Analysis
Beta Feature: Investment Analysis is currently in beta testing. Metrics are calculated based on available financial data and market comparables. Results are for informational purposes and should not be considered financial advice. Verify all assumptions and consult with a financial advisor before making investment decisions.
Financing Assumptions
Insufficient financial data for full analysis. Add more financial fields to improve metric coverage.
Market Employment Trend
December 2025 • Source: BLS QCEW
Economic Indicators
Source: FRED
Market Demographics
Census ACS 20242024 American Community Survey 5-Year Estimates •Released annually by U.S. Census Bureau
Sold Comps
Q1 2026Source: los_angeles_assessor · County FIPS: 06037
Assumptions
- Interest rate: 6.47% (FRED live)
- Loan term: 25 years
- Down payment: 25.0%
- Market comparison: retail in beverly hills, CA
More Retail for Sale in Beverly Hills, CA(5)
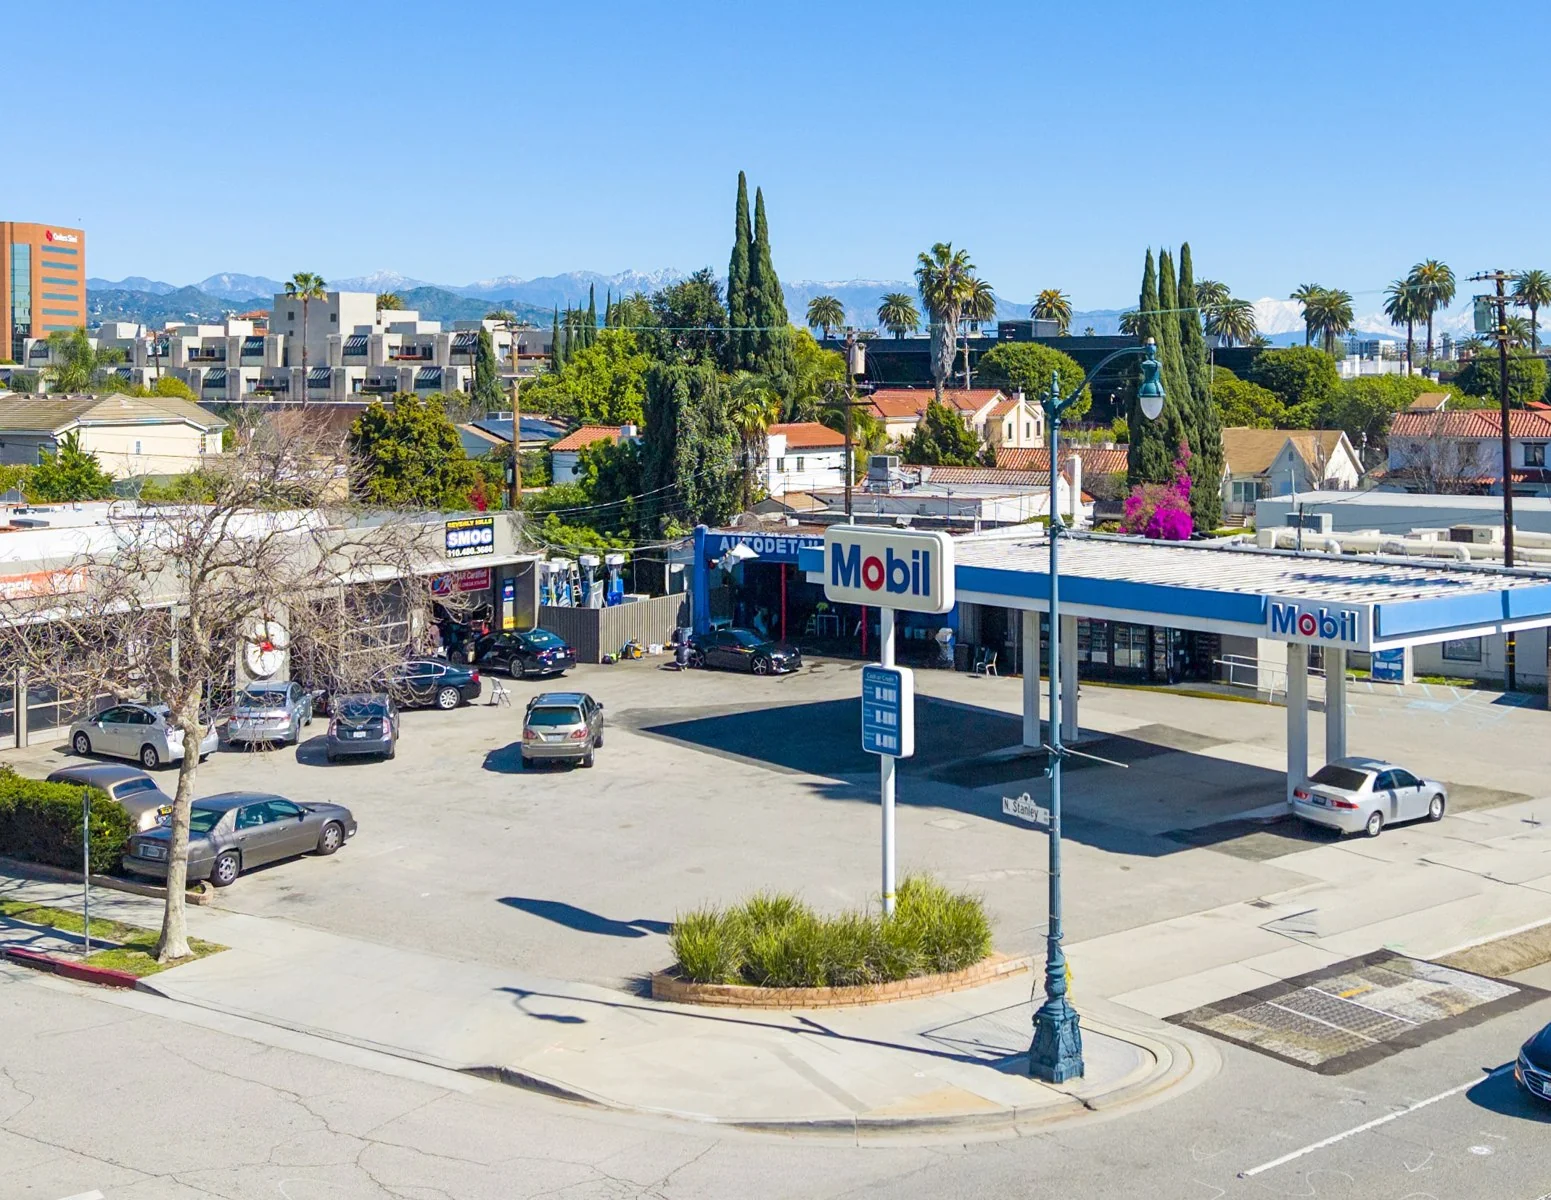
Retail in Beverly Hills, CA
beverly hills, CA
Price on request
Cap Rate
N/A
Price/SF
N/A
SF
N/A
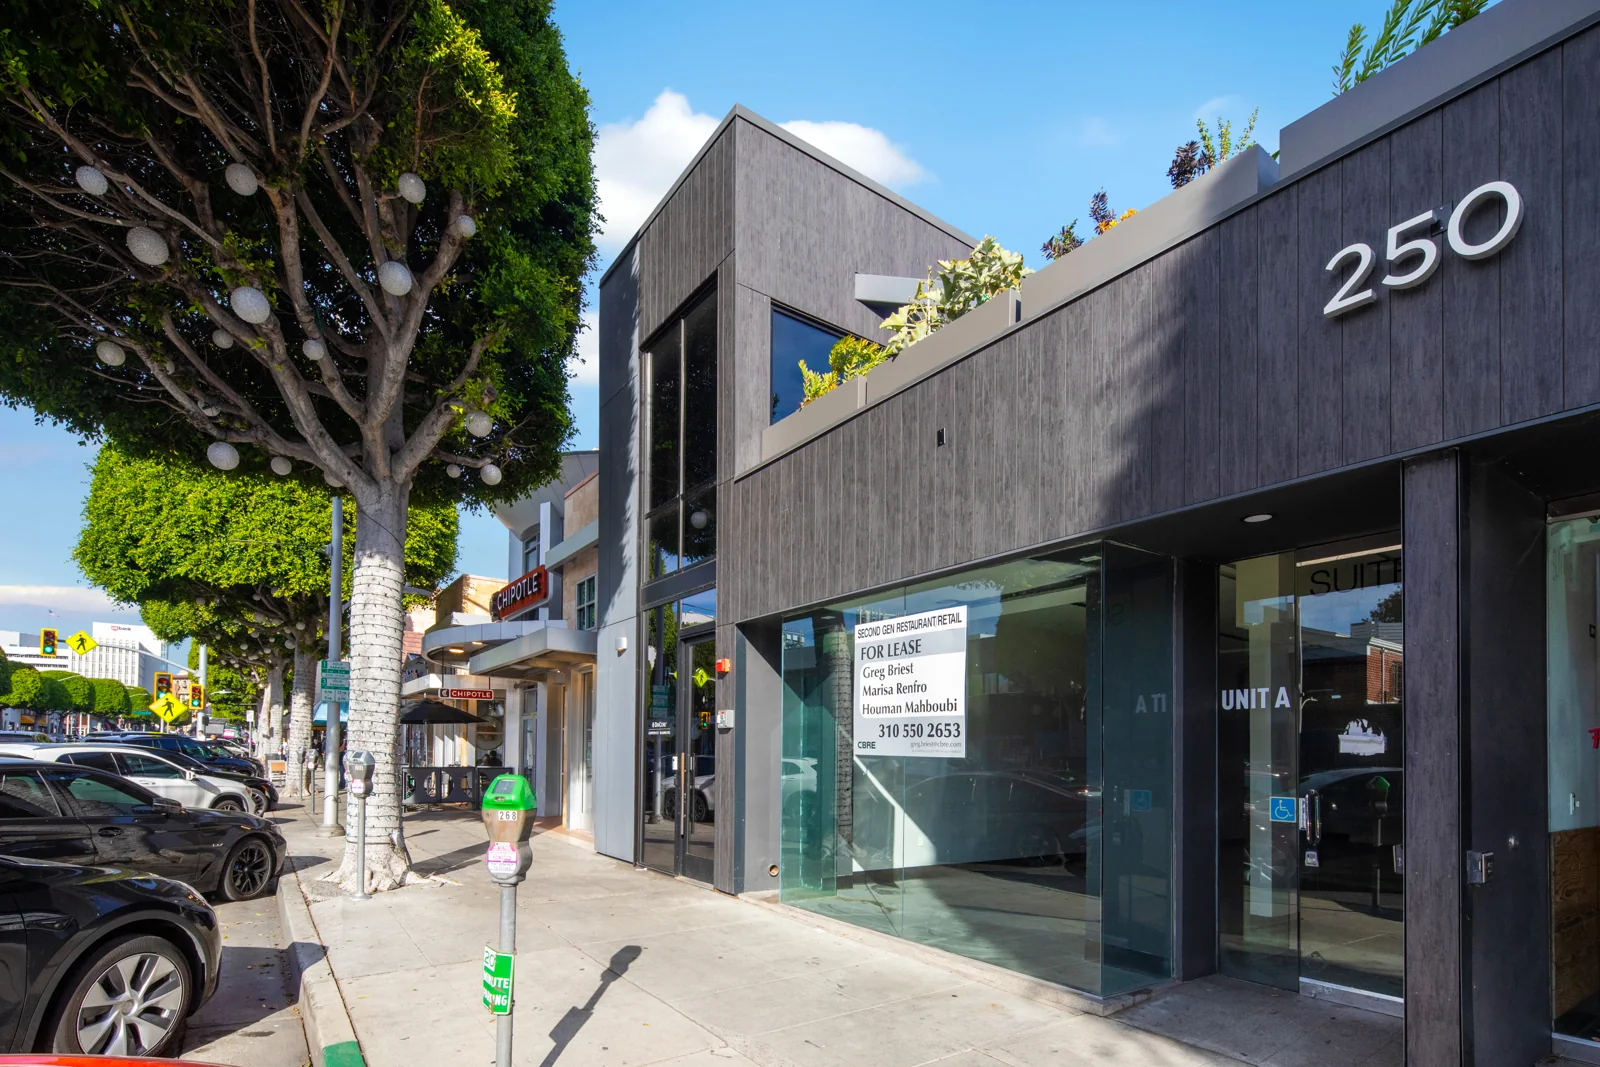
Retail in Beverly Hills, CA
beverly hills, CA
Price on request
Cap Rate
N/A
Price/SF
N/A
SF
N/A
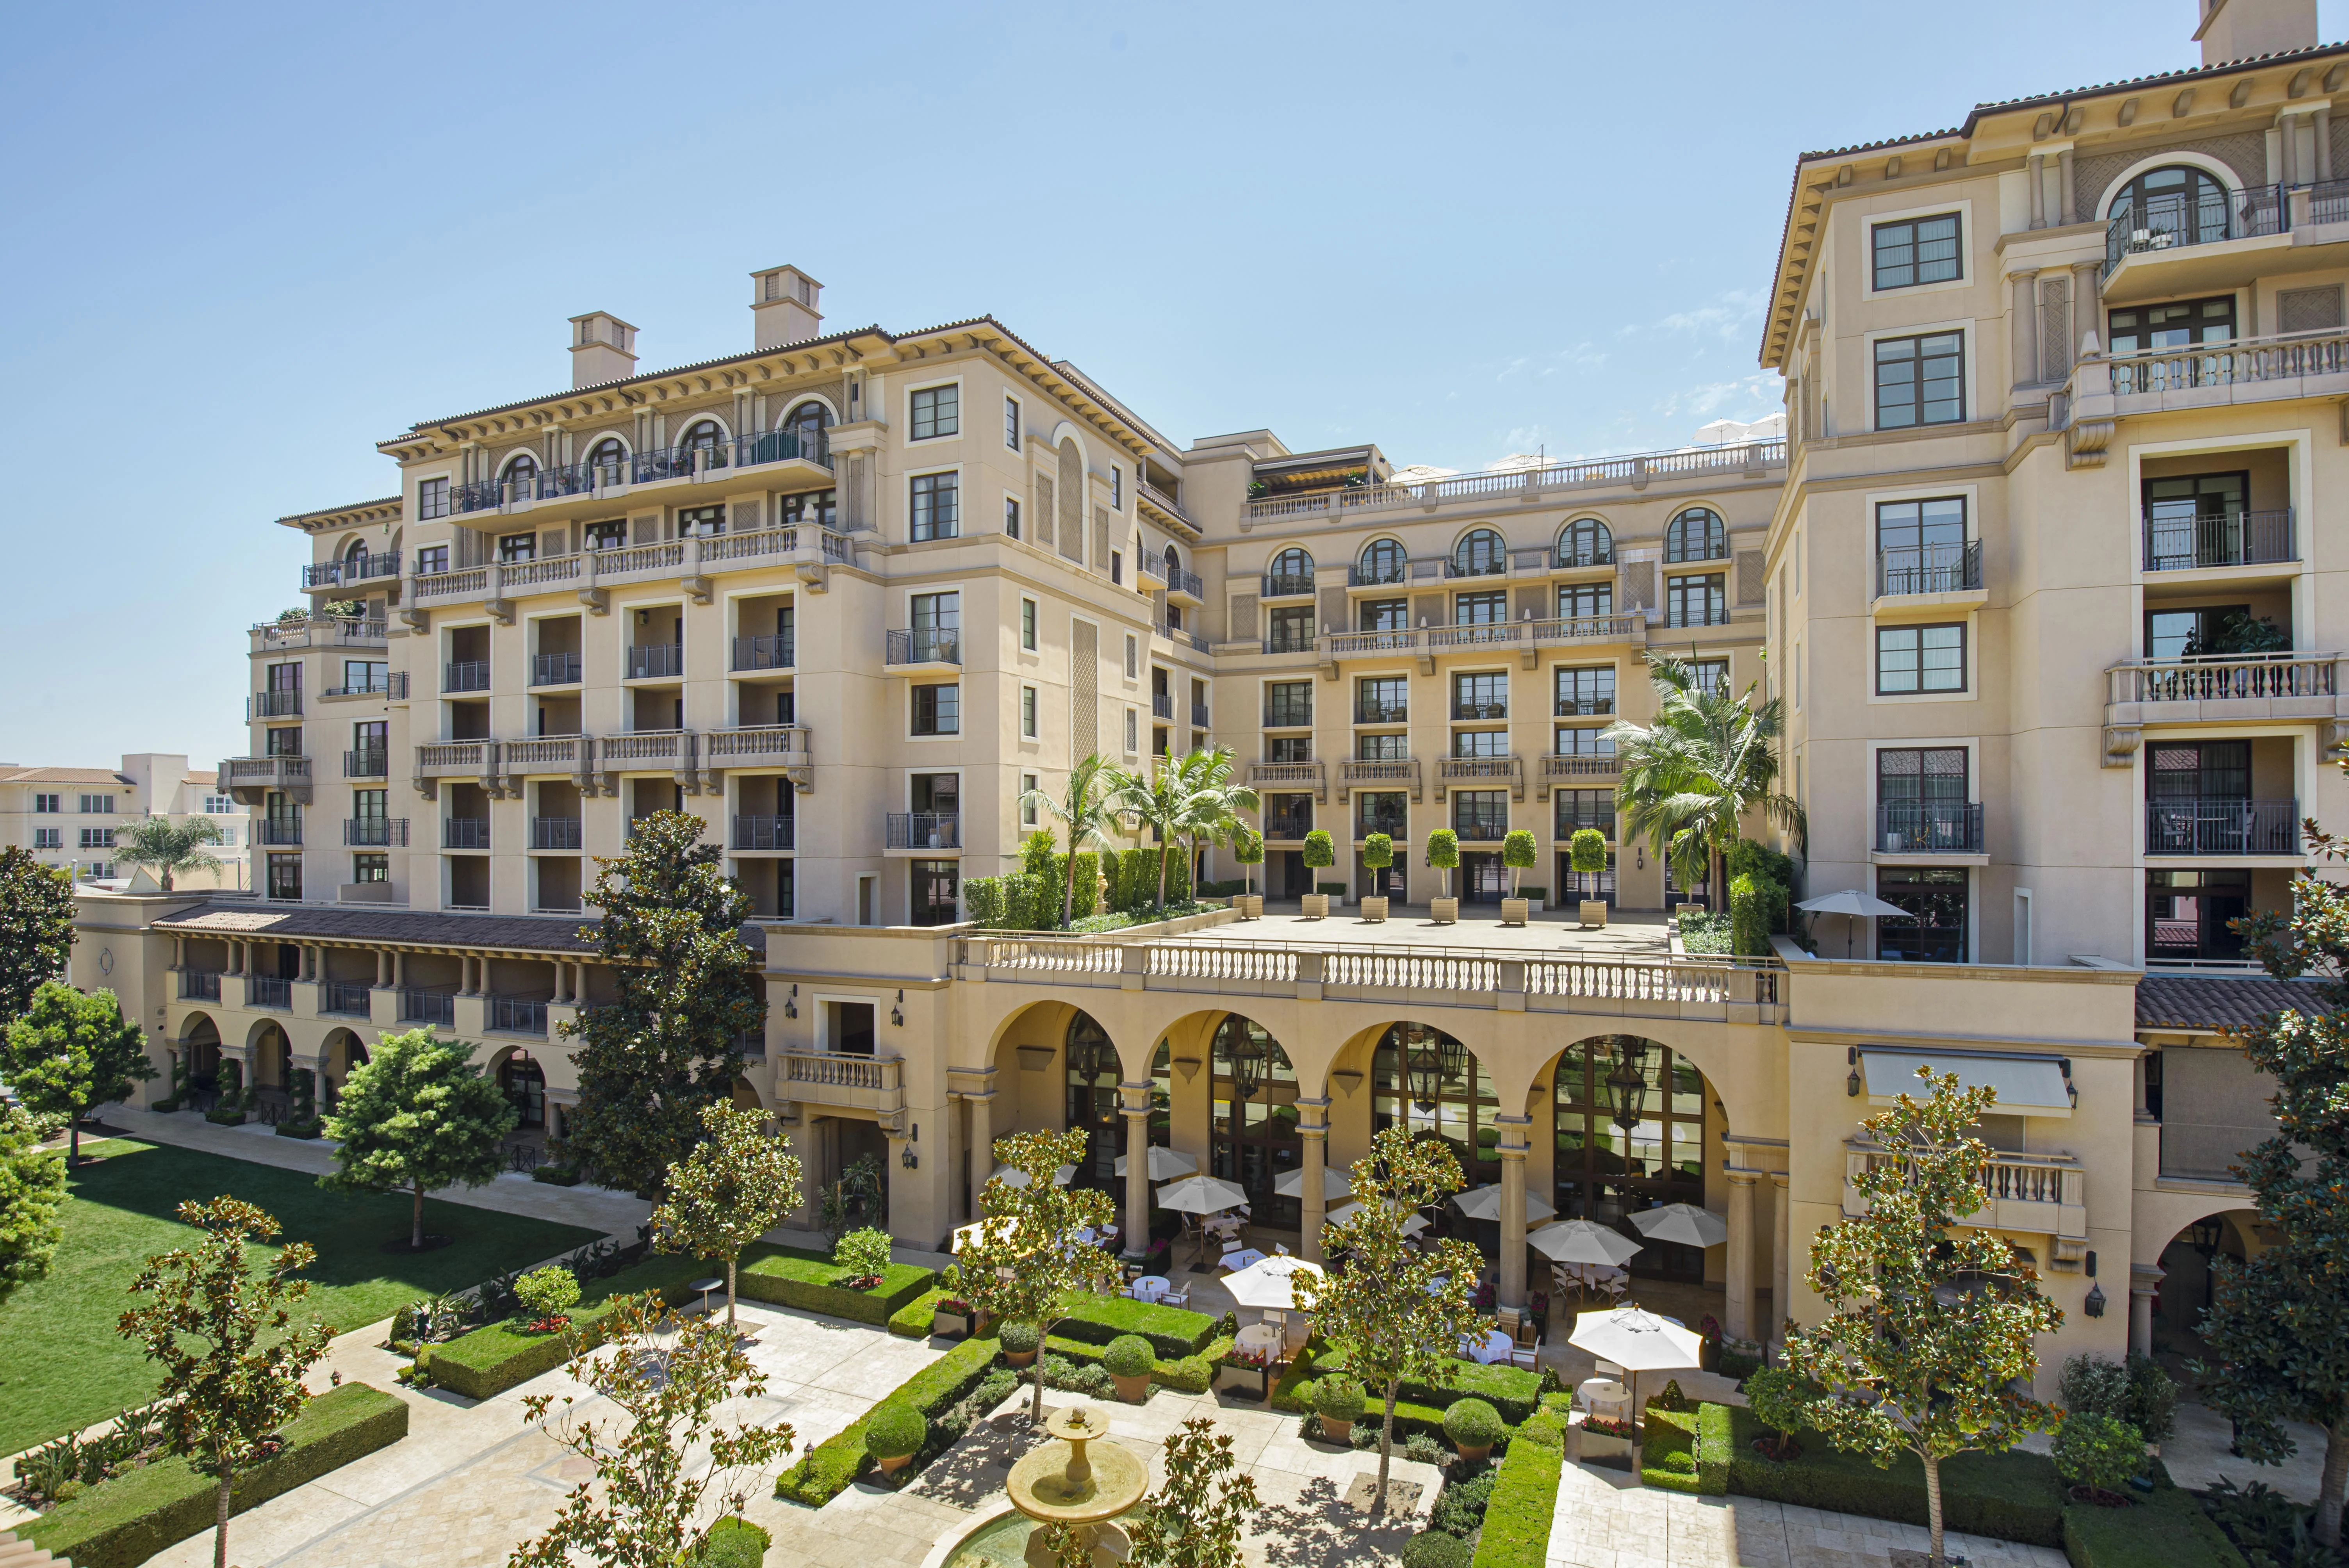
The Maybourne Beverly Hills
beverly hills, CA
Price on request
Cap Rate
N/A
Price/SF
N/A
SF
N/A
Retail in Los Angeles, CA
los angeles, CA
Price on request
Cap Rate
N/A
Price/SF
4.5/sf
SF
N/A

Retail in Los Angeles, CA
los angeles, CA
Price on request
Cap Rate
N/A
Price/SF
4.5/sf
SF
N/A
Documents
Contact Broker

Marisa Renfro

Houman Mahboubi

Greg Briest

Hunter Bercu
Neal Golub
Ryan Gurman
Listed by
CBRE System Import