Park Northern
Price
Price on request
Market rate estimate — not broker-provided
Cost-of-Business Details
Medium ConfidenceEstimated from market cap rate (6.3%), property tax rate (0.01%), and NYC PLUTO (12,128 parcels, assessed $/SF = 1).
| Component | Value | Detail | Source |
|---|---|---|---|
| Base Rent | $0.02/SF/mo | — | tax_cap_reverse |
| Utilities | — | 17.0¢/kWh | OpenEI URDB |
| Property Tax | — | 0.0% eff. rate | API Ninjas |
| Labor Index | — | $1413/wk | BLS QCEW |
Source Provenance (3)
| Source | Type | Count | Year | Freshness | Peer |
|---|---|---|---|---|---|
| Market Reports | cap_rate | — | — | quarterly | — |
| API Ninjas | property_tax | — | — | annual | — |
| NYC PLUTO | assessed_value_psf | — | — | annual | — |
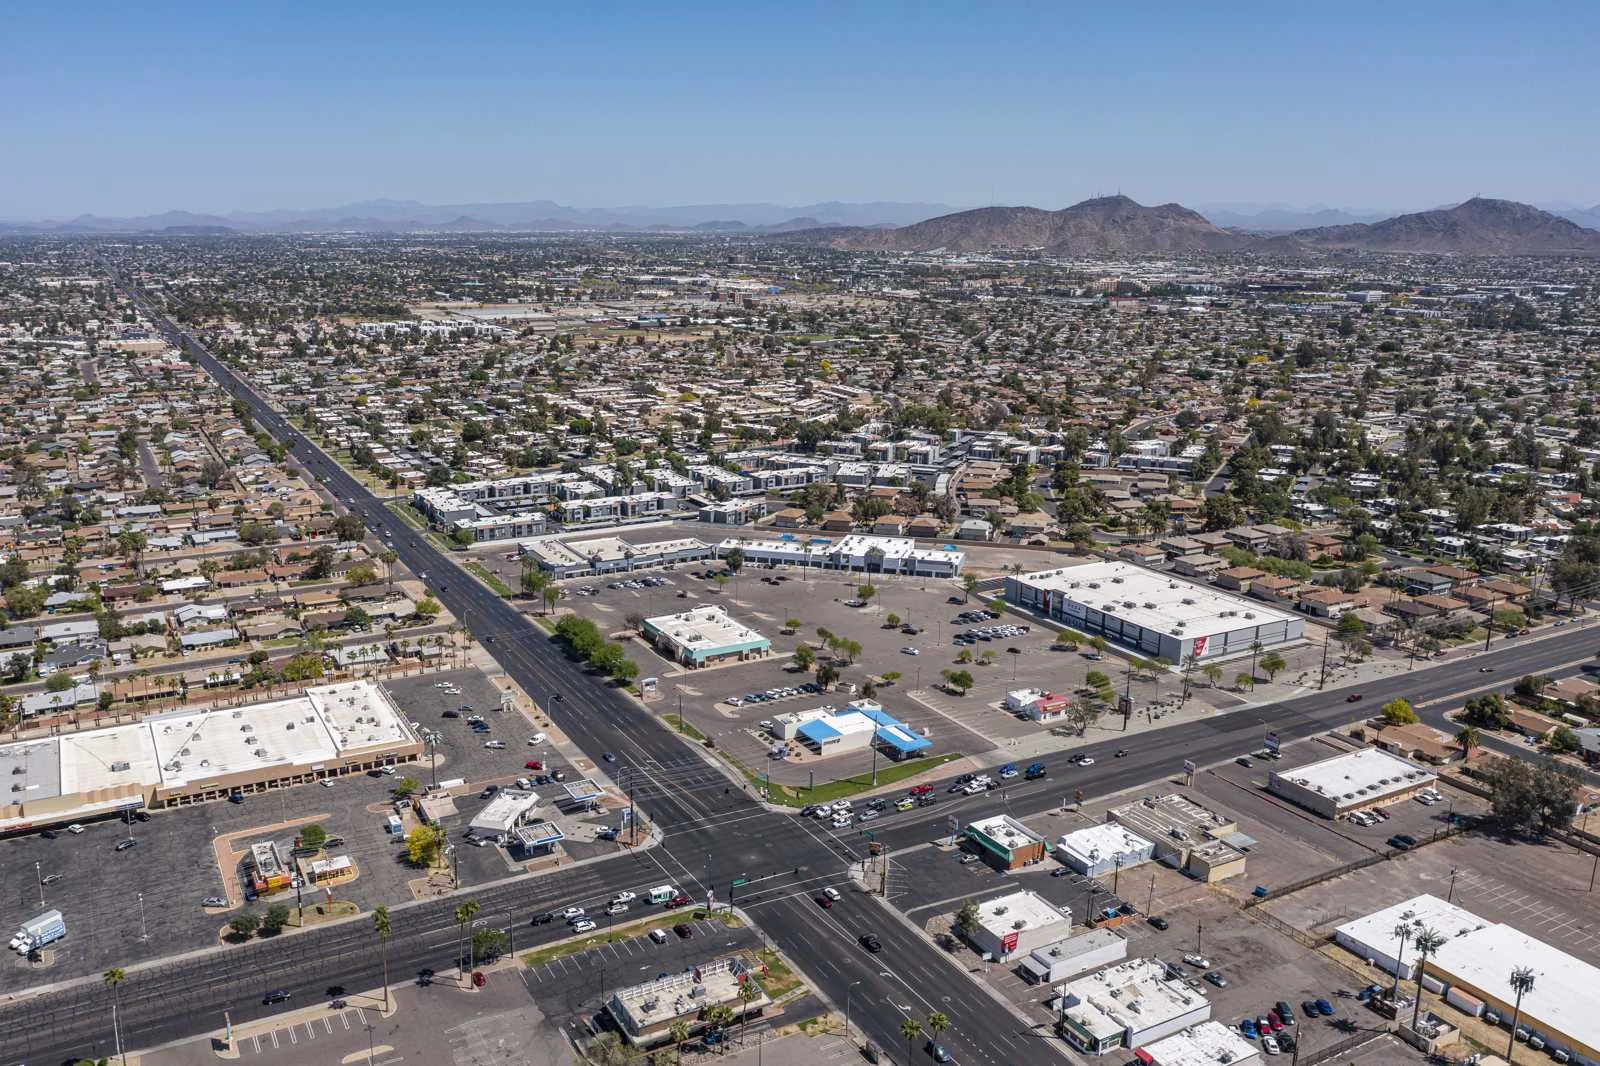
Description
- •For Lease
- •Dense population with a three-mile population in excess of 198,874*
- •Planned re-development
- •Located at a signalized intersection with good access and excellent visibility
- •Easy access from Interstate 17
Property description as provided by the listing source. PropZone adds independent market context, valuation estimates, and comparable listings.


Financial Details
Market Context
As of Q1 2026, the Phoenix retail market showed a 4.8% vacancy rate, and average asking rents near $19.00/SF/yr. Source: multiple brokerages Q1 2026 market report.
Projected current pricing
low confidenceModeled estimate (income approach) shown as a range — not an appraisal. Projected asking rent × occupancy × net-operating-income margin band ÷ market cap rate, from Q1 2026 multiple brokerages data (cap rate 6.3%, asking rent held flat).
Tight vacancy keeps competition for quality space elevated.
Compare it against other retail listings for lease in Phoenix, AZ to benchmark pricing and space — view the full market.
Retail market FAQ
- Is the Phoenix retail market tightening or softening?
- Vacancy is around 4.8% (Q1 2026).
Unified Estimate
Medium ConfidenceRate-first confidence-weighted blend with cost-of-business adjustment.
Lease Rate & Market Trend
2023 – 2026 · county sold comps + market trendsFIPS 04013
- Avg Rent ($/SF/mo) (market data)
- Median $/SF (sold)
- Vacancy %
Investment Analysis
Beta Feature: Investment Analysis is currently in beta testing. Metrics are calculated based on available financial data and market comparables. Results are for informational purposes and should not be considered financial advice. Verify all assumptions and consult with a financial advisor before making investment decisions.
Insufficient financial data for full analysis. Add more financial fields to improve metric coverage.
Market Employment Trend
December 2025 • Source: BLS QCEW
Economic Indicators
Source: FRED
Market Demographics
Census ACS 20242024 American Community Survey 5-Year Estimates •Released annually by U.S. Census Bureau
Sold Comps
Q2 2026Source: maricopa_az · County FIPS: 04013
Assumptions
- Market comparison: retail in phoenix, AZ
More Retail for Lease in Phoenix, AZ(5)

Arizona Center
Phoenix, AZ
Price on request
Cap Rate
N/A
Price/SF
N/A
SF
112.3K
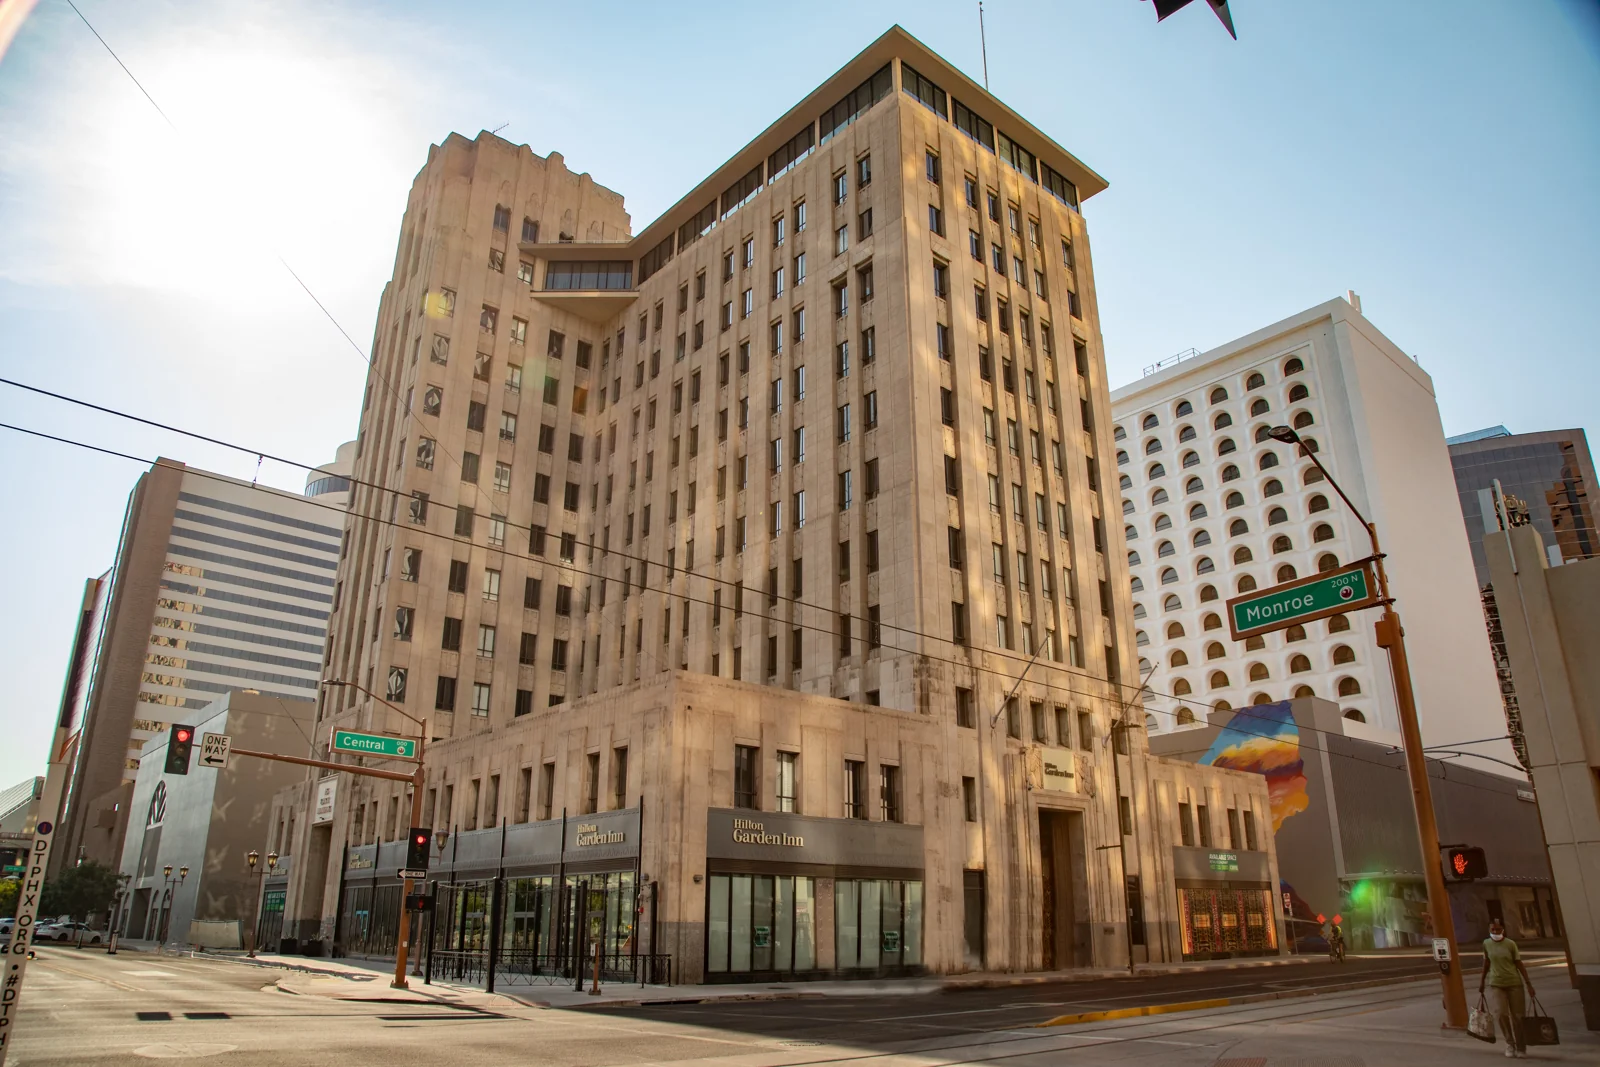
Hilton Garden Inn
phoenix, AZ
Price on request
Cap Rate
N/A
Price/SF
N/A
SF
N/A

Mountain Park Plaza
phoenix, AZ
Price on request
Cap Rate
N/A
Price/SF
N/A
SF
N/A
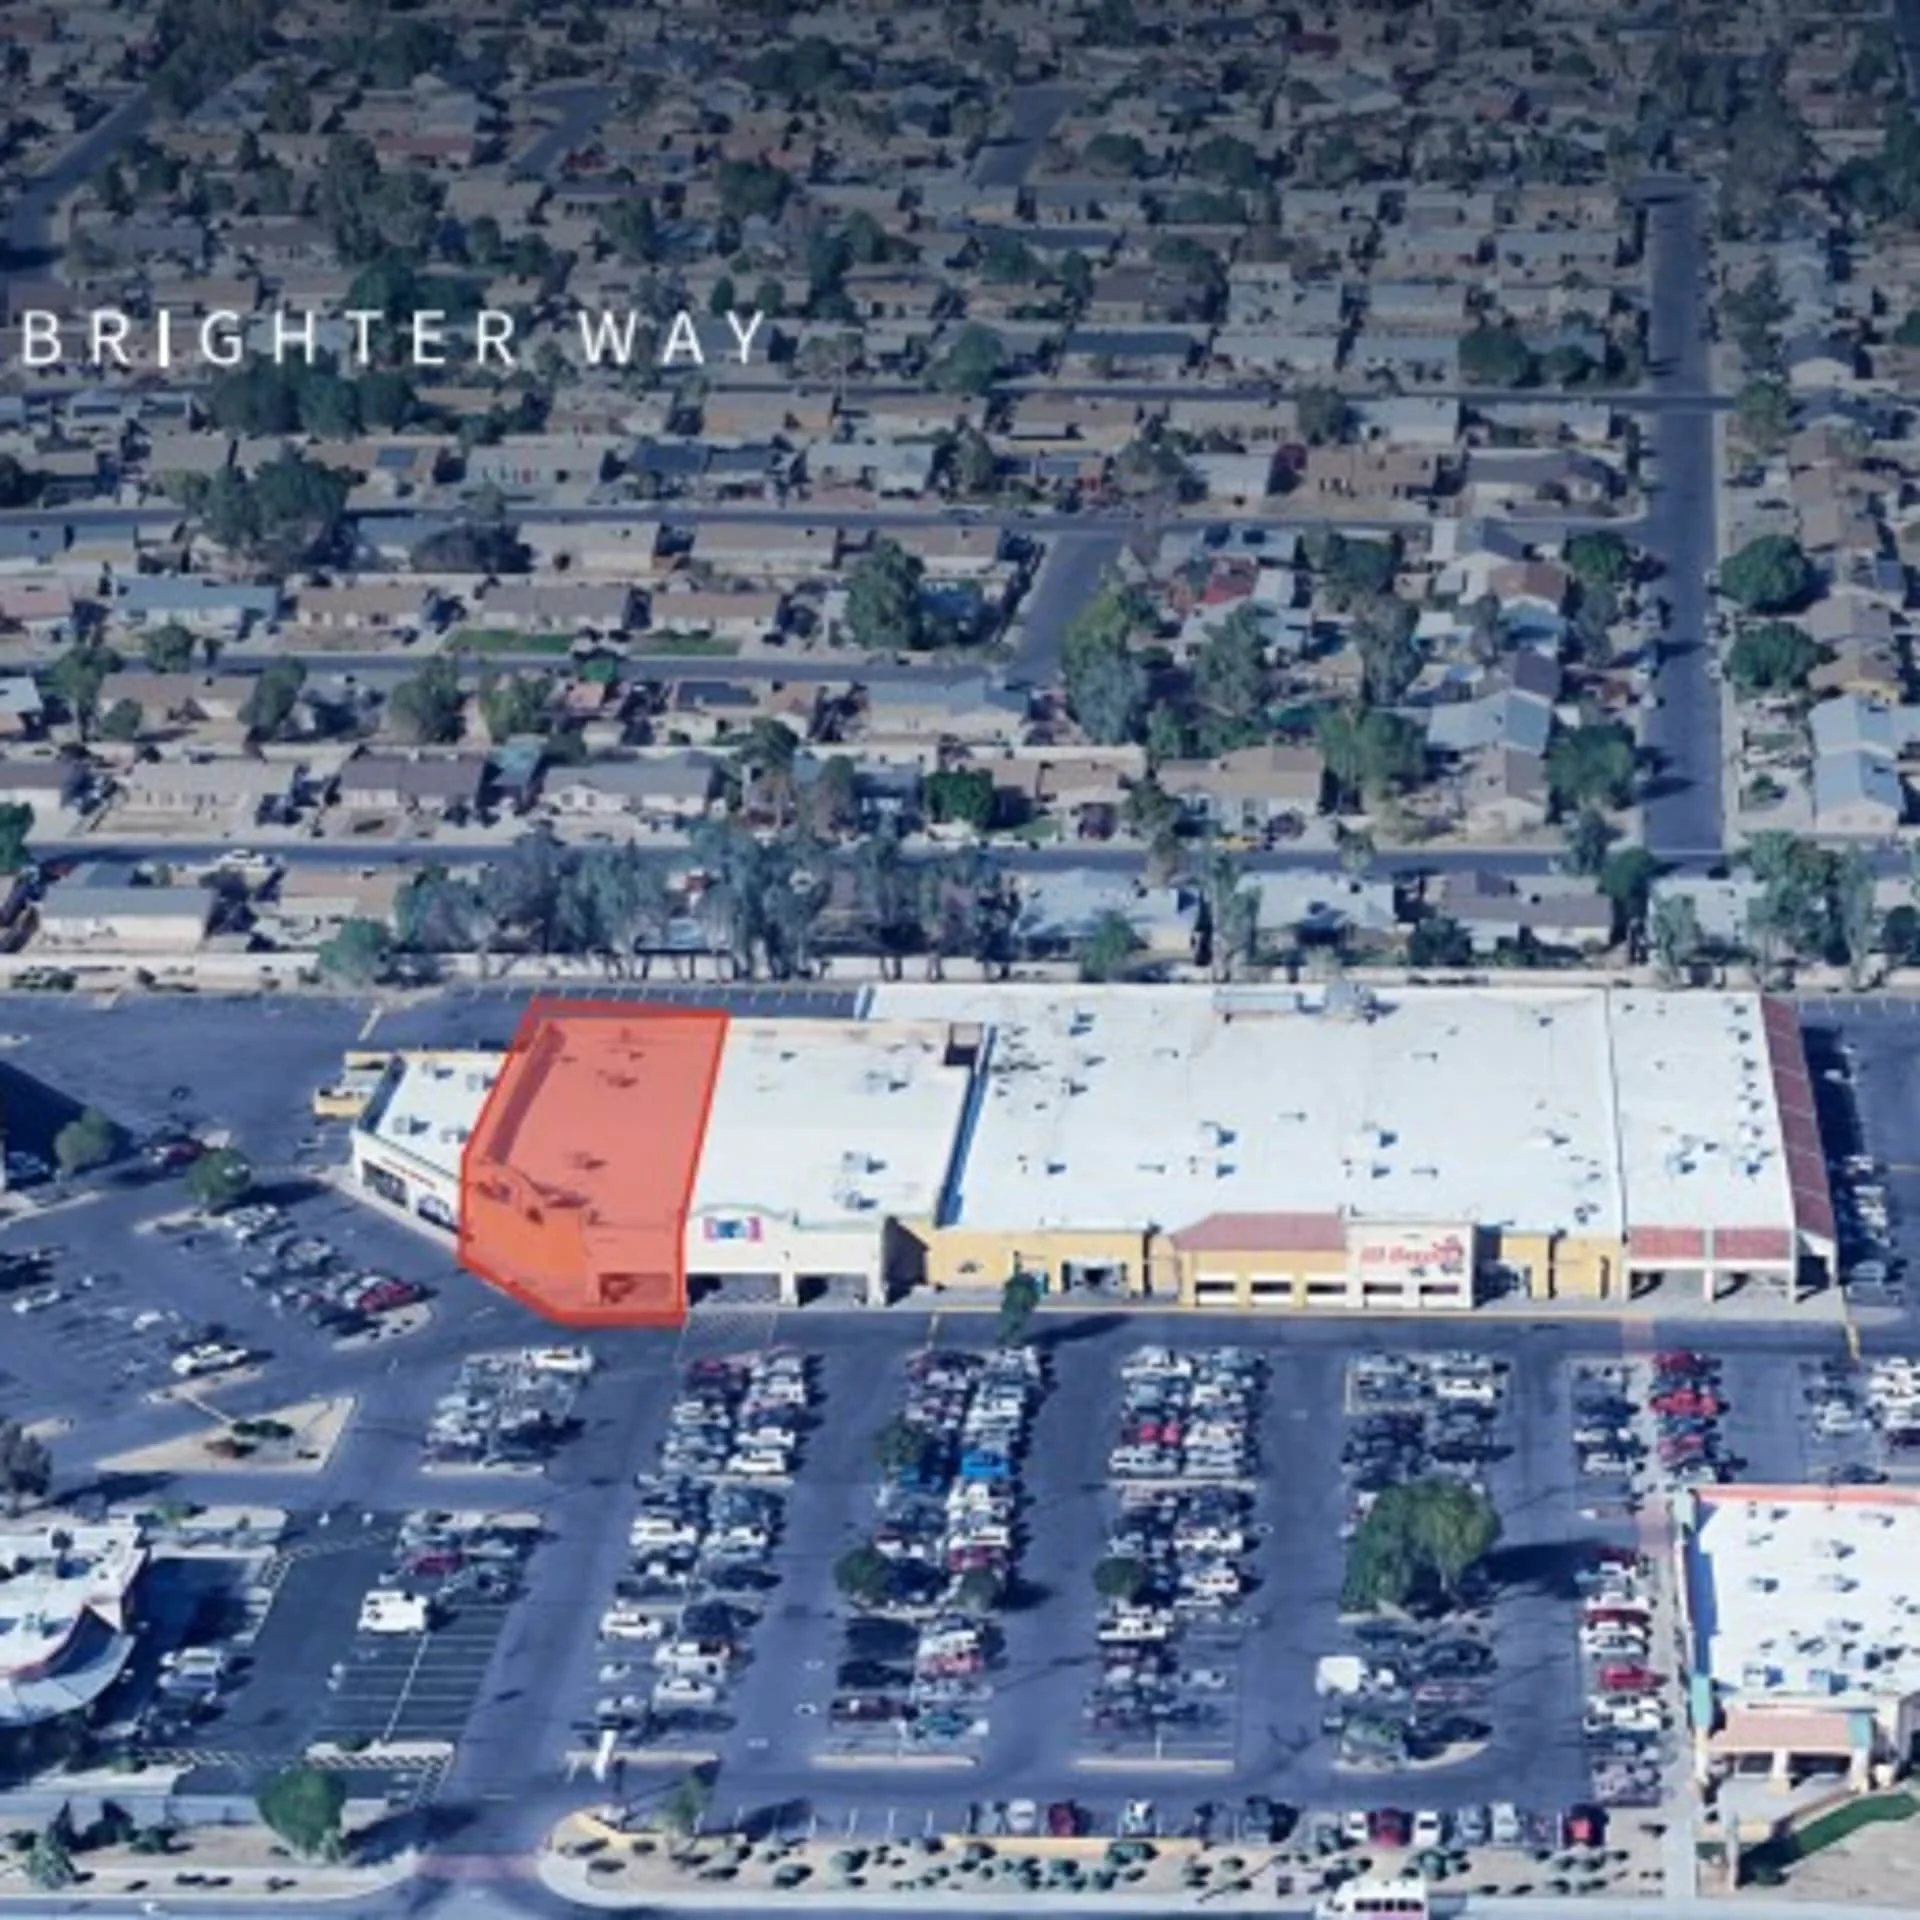
7520-7620 W Thomas Rd
phoenix, AZ
Price on request
Cap Rate
N/A
Price/SF
N/A
SF
N/A
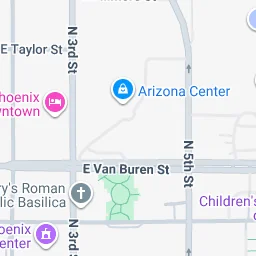
Arizona Center
phoenix, AZ
Price on request
Cap Rate
N/A
Price/SF
N/A
SF
112.3K
Documents
Contact Broker

Bill Bones

Theresa Lau
Listed by
CBRE System Import