Northpointe Trade Center, Building C | Sublease
Price
Price on request
Market rate estimate — not broker-provided
Cost-of-Business Details
Very Low ConfidenceTransferred from peer market fort-lauderdale (similarity: 100%) with 4 comparable listings.
| Component | Value | Detail | Source |
|---|---|---|---|
| Base Rent | $17.00/SF/mo | — | peer_city_transfer |
| Utilities | — | 8.3¢/kWh | OpenEI URDB |
| Property Tax | — | 0.0% eff. rate | API Ninjas |
| Labor Index | — | $1932/wk | BLS QCEW |
Source Provenance (1)
| Source | Type | Count | Year | Freshness | Peer |
|---|---|---|---|---|---|
| Peer City Transfer | economic_similarity | 4 | — | real-time | fort-lauderdale (100%) |
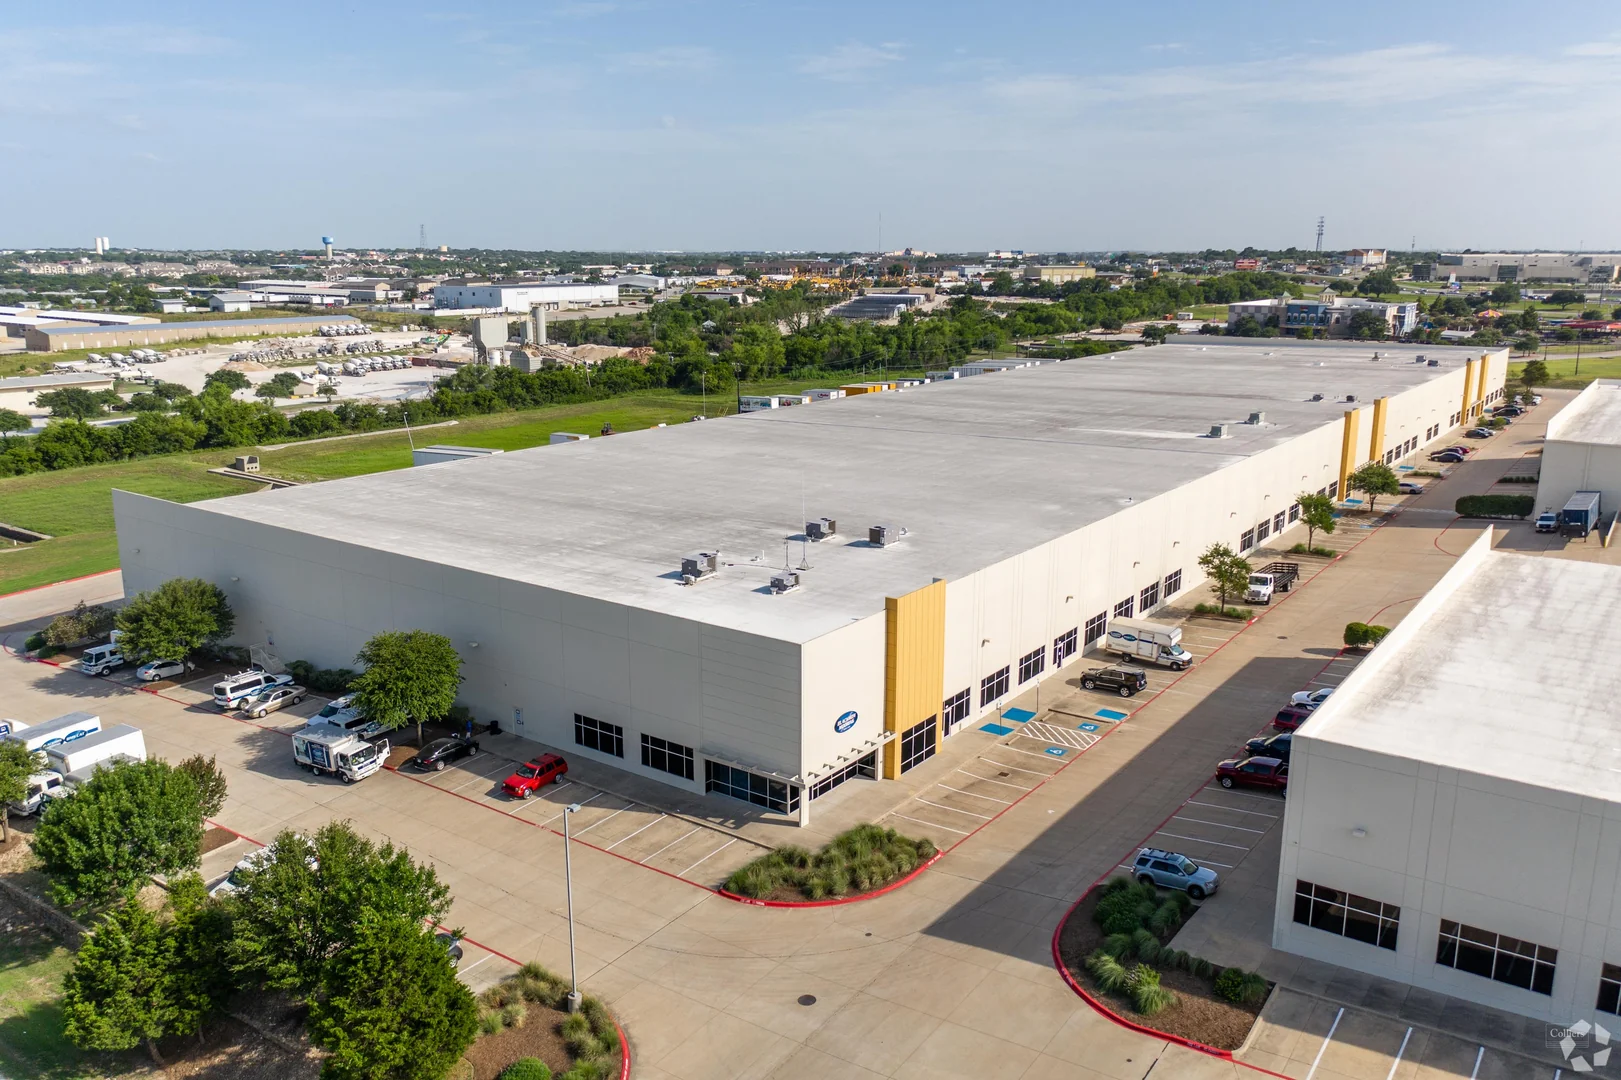
Description
Industrial | For Sublease: 64,847 SF Northpointe Trade Center Building C for sublease. Available in 90 days.64,847 SF available3,932 SF office space Key Facts Travis Hicks Senior Vice President Austin License #: 539389 +1 512 539 3005 Call Now +1 512 539 3005 +1 512 964 8434 Call Mobile +1 512 964 8434 License #: 539389 Chase Clancy Senior Vice President Austin License #: 680153 +1 512 539 3024 Call Now +1 512 539 3024 +1 512 317 3790 Call Mobile +1 512 317 3790 Michael Modesett Associate Austin License #: 709910 +1 512 539 3015 Call Now +1 512 539 3015 +1 512 964 2726 Call Mobile +1 512 964 2726
Property description as provided by the listing source. PropZone adds independent market context, valuation estimates, and comparable listings.
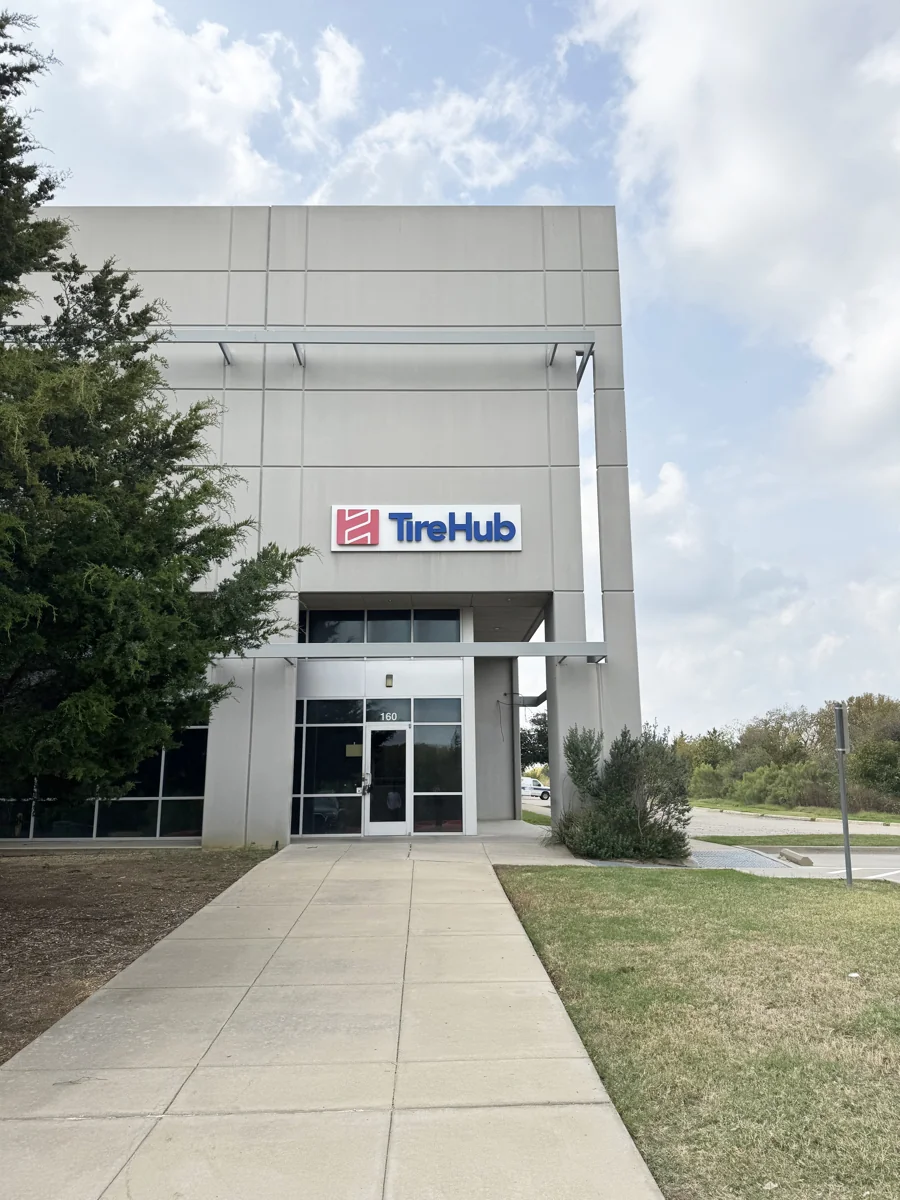
Location
2251 Picadilly Dr, Round Rock, TX 78664, USA, Round Rock, TX 78664


Market Context
As of Q1 2026, the Austin industrial market showed a 15.1% vacancy rate, average asking rents near $14.30/SF/yr, and cap rates around 7.6%. Source: multiple brokerages Q1 2026 market report.
Projected current pricing
high confidenceModeled estimate (income approach) shown as a range — not an appraisal. Projected asking rent × occupancy × net-operating-income margin band ÷ market cap rate, from Q1 2026 multiple brokerages data (cap rate 7.6%, asking rent held flat).
Above-average vacancy gives tenants leverage and a wide set of comparables.
Compare it against other industrial listings for lease in Round Rock, TX to benchmark pricing and space — view the full market.
Industrial market FAQ
- What is the typical cap rate for industrial in Austin?
- About 7.6% as of Q1 2026, per multiple brokerages.
- Is the Austin industrial market tightening or softening?
- Vacancy is around 15.1% (Q1 2026).
Unified Estimate
Very Low ConfidenceRate-first confidence-weighted blend with cost-of-business adjustment.
No local comparable sales were available, so this estimate is transferred from a comparable peer market — treat it as a rough indication only. Transferred from peer market fort-lauderdale (similarity: 100%) with 4 comparable listings.
Lease Rate & Market Trend
Market report quarterly trend fallback
- Avg Rent ($/SF/mo) (market data)
- Vacancy %
Investment Analysis
Beta Feature: Investment Analysis is currently in beta testing. Metrics are calculated based on available financial data and market comparables. Results are for informational purposes and should not be considered financial advice. Verify all assumptions and consult with a financial advisor before making investment decisions.
Insufficient financial data for full analysis. Add more financial fields to improve metric coverage.
Market Employment Trend
December 2025 • Source: BLS QCEW
Economic Indicators
Source: FRED
Market Demographics
Census ACS 20242024 American Community Survey 5-Year Estimates •Released annually by U.S. Census Bureau
Assumptions
- Market comparison: industrial in Round Rock, TX
More Industrial for Lease in Round Rock, TX(5)
CrossPoint - Building 2 - Sublease
georgetown, TX
Price on request
Cap Rate
N/A
Price/SF
N/A
SF
N/A

Eisenhauer Business Park - Suite 270
san antonio, TX
Price on request
Cap Rate
N/A
Price/SF
N/A
SF
N/A

For Sublease I Office/Warehouse
Houston, TX
Price on request
Cap Rate
N/A
Price/SF
N/A
SF
N/A
52,000 SF Industrial for Sublease
arlington, TX
Price on request
Cap Rate
N/A
Price/SF
N/A
SF
N/A

NorthLink Building C
fort worth, TX
Price on request
Cap Rate
N/A
Price/SF
N/A
SF
N/A
Contact Broker
Travis Hicks
Chase Clancy
Michael Modesett
Broker 4
Broker 5
Broker 6
Listed by
Colliers Import