Newberry Building
Price
Price on request
Market rate estimate — not broker-provided
Cost-of-Business Details
Low ConfidenceBased on 4 comparable office sale listings in the area.
| Component | Value | Detail | Source |
|---|---|---|---|
| Base Rent | $21.00/SF | — | direct_comps |
| Utilities | — | 10.1¢/kWh | OpenEI URDB |
| Property Tax | — | 0.0% eff. rate | API Ninjas |
| Labor Index | — | $1507/wk | BLS QCEW |
Source Provenance (1)
| Source | Type | Count | Year | Freshness | Peer |
|---|---|---|---|---|---|
| OpenSearch Listings | comparable_listings | 4 | — | real-time | — |
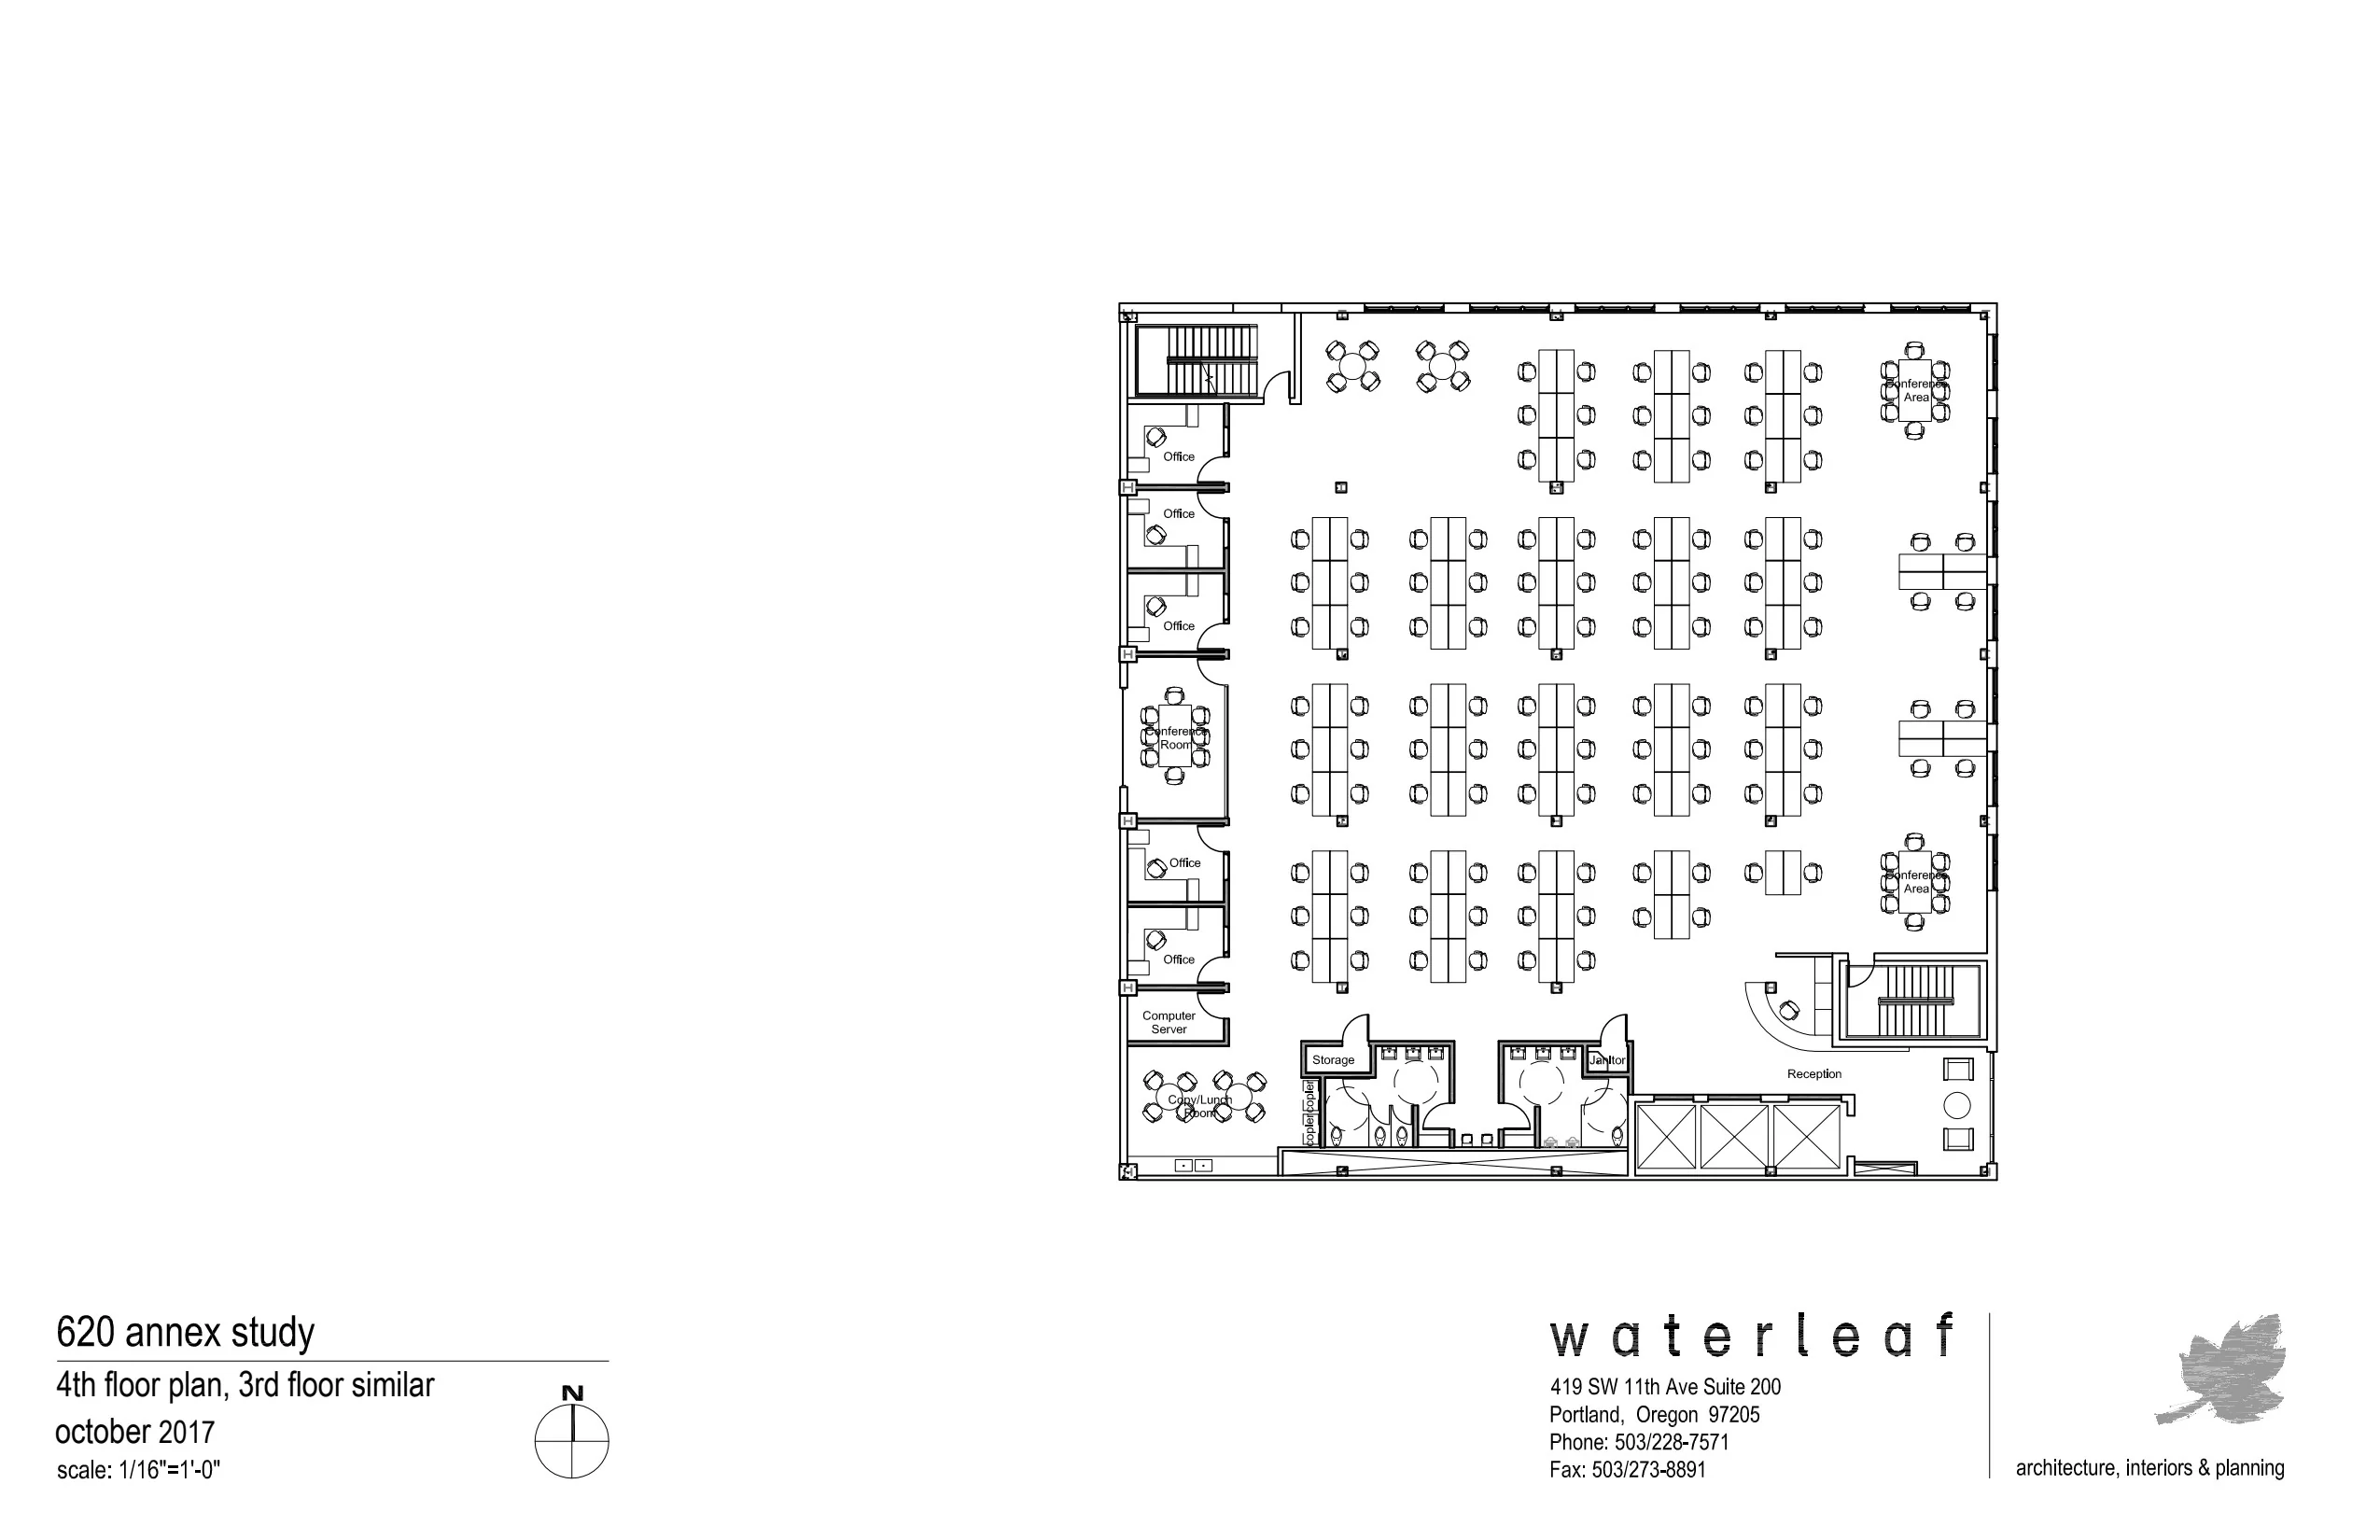
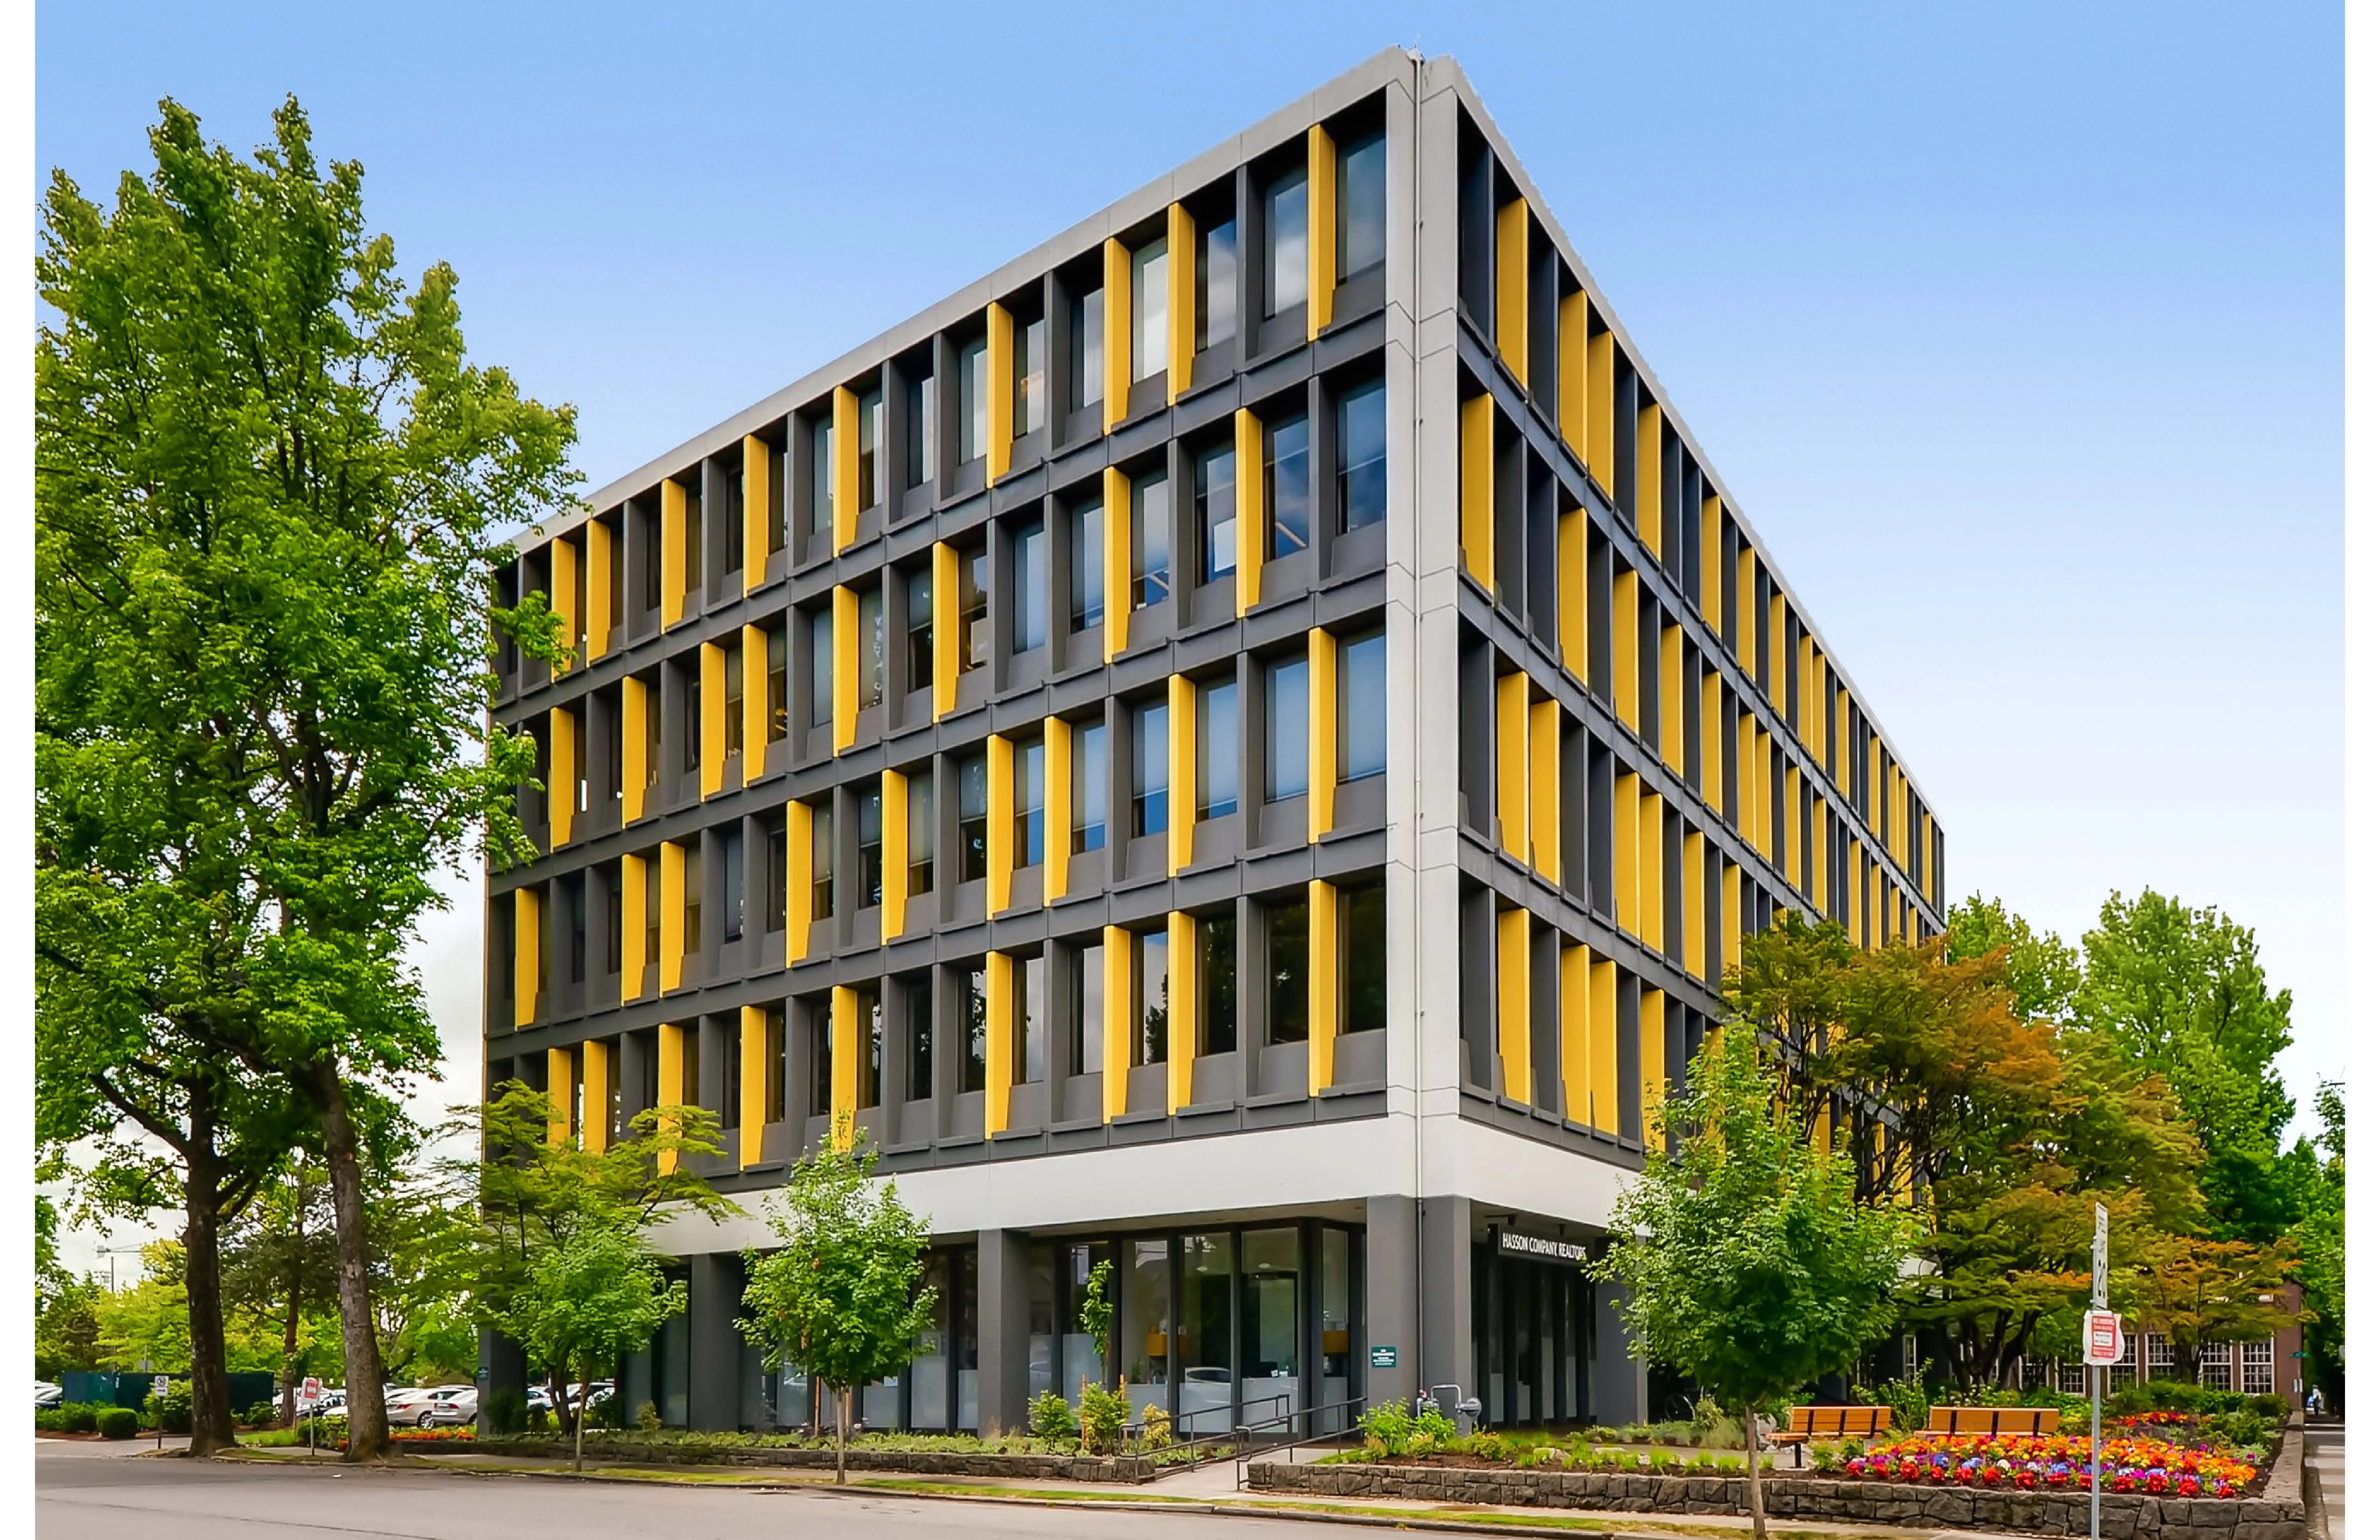
Description
Located in the heart of the CBD, the 620 & NEWBERRY BUILDINGS offer creative office suites from 300 to 55,000 RSF. Superior access to retail, restaurants, transit, and parking Building conference room with WiFi Views of the river, mountains and downtown Adjacent to Pioneer Place, Nike Town, The Nines Hotel, and Hotel Monaco At the intersection of 2 MAX lines Top of building signage opportunities On-site bike parking, exercise facility, and building locker rooms and showers Free quarterly bike repair and maintenance for tenants Lease rate: $24.50 to $29.50/RSF full service
Property description as provided by the listing source. PropZone adds independent market context, valuation estimates, and comparable listings.


Market Context
As of Q1 2026, the Portland office market showed a 27.1% vacancy rate, and average asking rents near $32.00/SF/yr. Source: multiple brokerages Q1 2026 market report.
Projected current pricing
indicative confidenceModeled estimate (income approach) shown as a range — not an appraisal. No market-specific cap rate is published for Portland office yet, so this applies the typical cap rate across comparable office markets — treat it as a rough, indicative range that sharpens as sourced cap rates arrive. Projected asking rent × occupancy × net-operating-income margin band ÷ a benchmark cap rate, from Q1 2026 asking-rent data (benchmark cap rate 6.6%–8.6%, asking rent held flat).
Above-average vacancy gives buyers leverage and a wide set of comparables.
Compare it against other office listings for sale in Portland, OR to benchmark pricing and space — view the full market.
Office market FAQ
- Is the Portland office market tightening or softening?
- Vacancy is around 27.1% (Q1 2026).
Unified Estimate
Medium ConfidenceRate-first confidence-weighted blend with cost-of-business adjustment.
Sale Price History
Market report quarterly trend fallback
- Avg Rent ($/SF/yr) (market data)
- Vacancy %
Investment Analysis
Beta Feature: Investment Analysis is currently in beta testing. Metrics are calculated based on available financial data and market comparables. Results are for informational purposes and should not be considered financial advice. Verify all assumptions and consult with a financial advisor before making investment decisions.
Financing Assumptions
Insufficient financial data for full analysis. Add more financial fields to improve metric coverage.
Market Employment Trend
December 2025 • Source: BLS QCEW
Economic Indicators
Source: FRED
Market Demographics
Census ACS 20242024 American Community Survey 5-Year Estimates •Released annually by U.S. Census Bureau
Assumptions
- Interest rate: 6.47% (FRED live)
- Loan term: 25 years
- Down payment: 25.0%
- Market comparison: office in portland, OR
More Office for Sale in Portland, OR(4)

Award-Winning Office Building For Sale
Portland, OR
Price on request
Cap Rate
N/A
Price/SF
N/A
SF
N/A
1500 Plaza Building
portland, OR
Price on request
Cap Rate
N/A
Price/SF
N/A
SF
N/A
Newberry Building
617 SW 4th Ave Portland, OR
Price on request
Cap Rate
N/A
Price/SF
N/A
SF
N/A
WCI Building
hillsboro, OR
Price on request
Cap Rate
N/A
Price/SF
28.0/sf
SF
N/A