Industrial Space Available in Park 100
Price
Price on request
Market rate estimate — not broker-provided
Cost-of-Business Details
Very Low ConfidenceTransferred from peer market tampa (similarity: 100%) with 4 comparable listings.
| Component | Value | Detail | Source |
|---|---|---|---|
| Base Rent | $1.50/SF/mo | — | peer_city_transfer |
| Utilities | — | 5.1¢/kWh | OpenEI URDB |
| Property Tax | — | 0.0% eff. rate | API Ninjas |
| Labor Index | — | $1450/wk | BLS QCEW |
Source Provenance (1)
| Source | Type | Count | Year | Freshness | Peer |
|---|---|---|---|---|---|
| Peer City Transfer | economic_similarity | 4 | — | real-time | tampa (100%) |
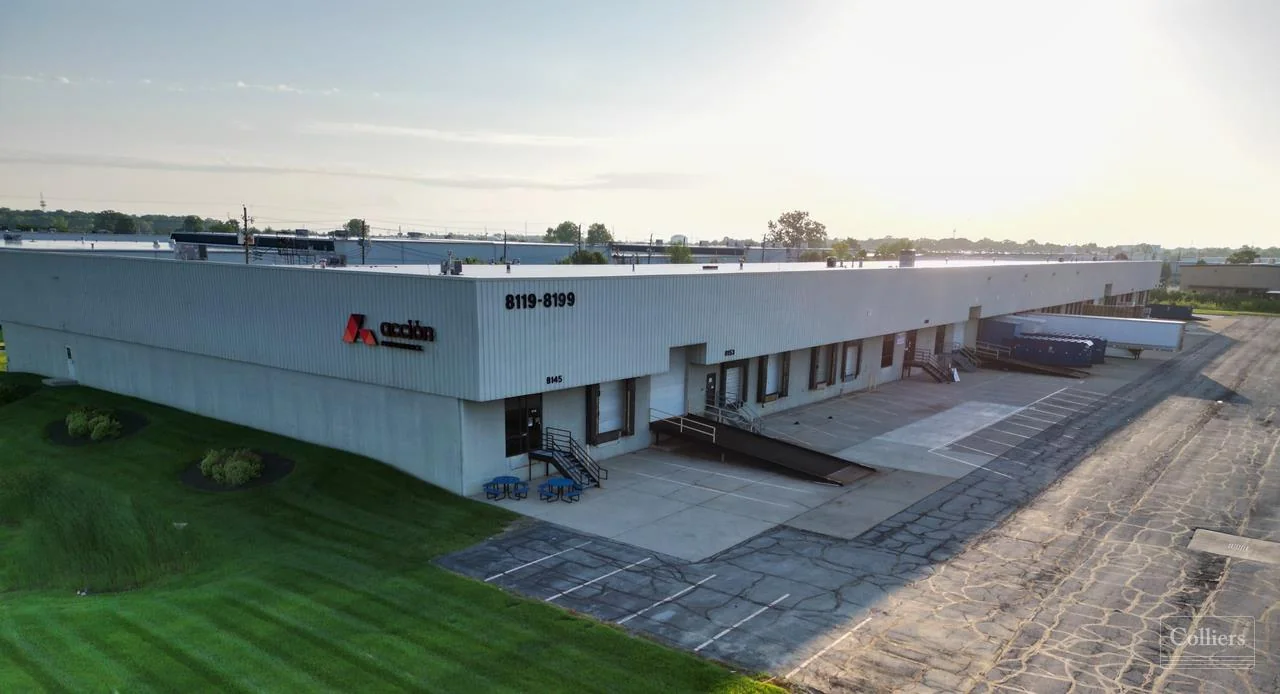
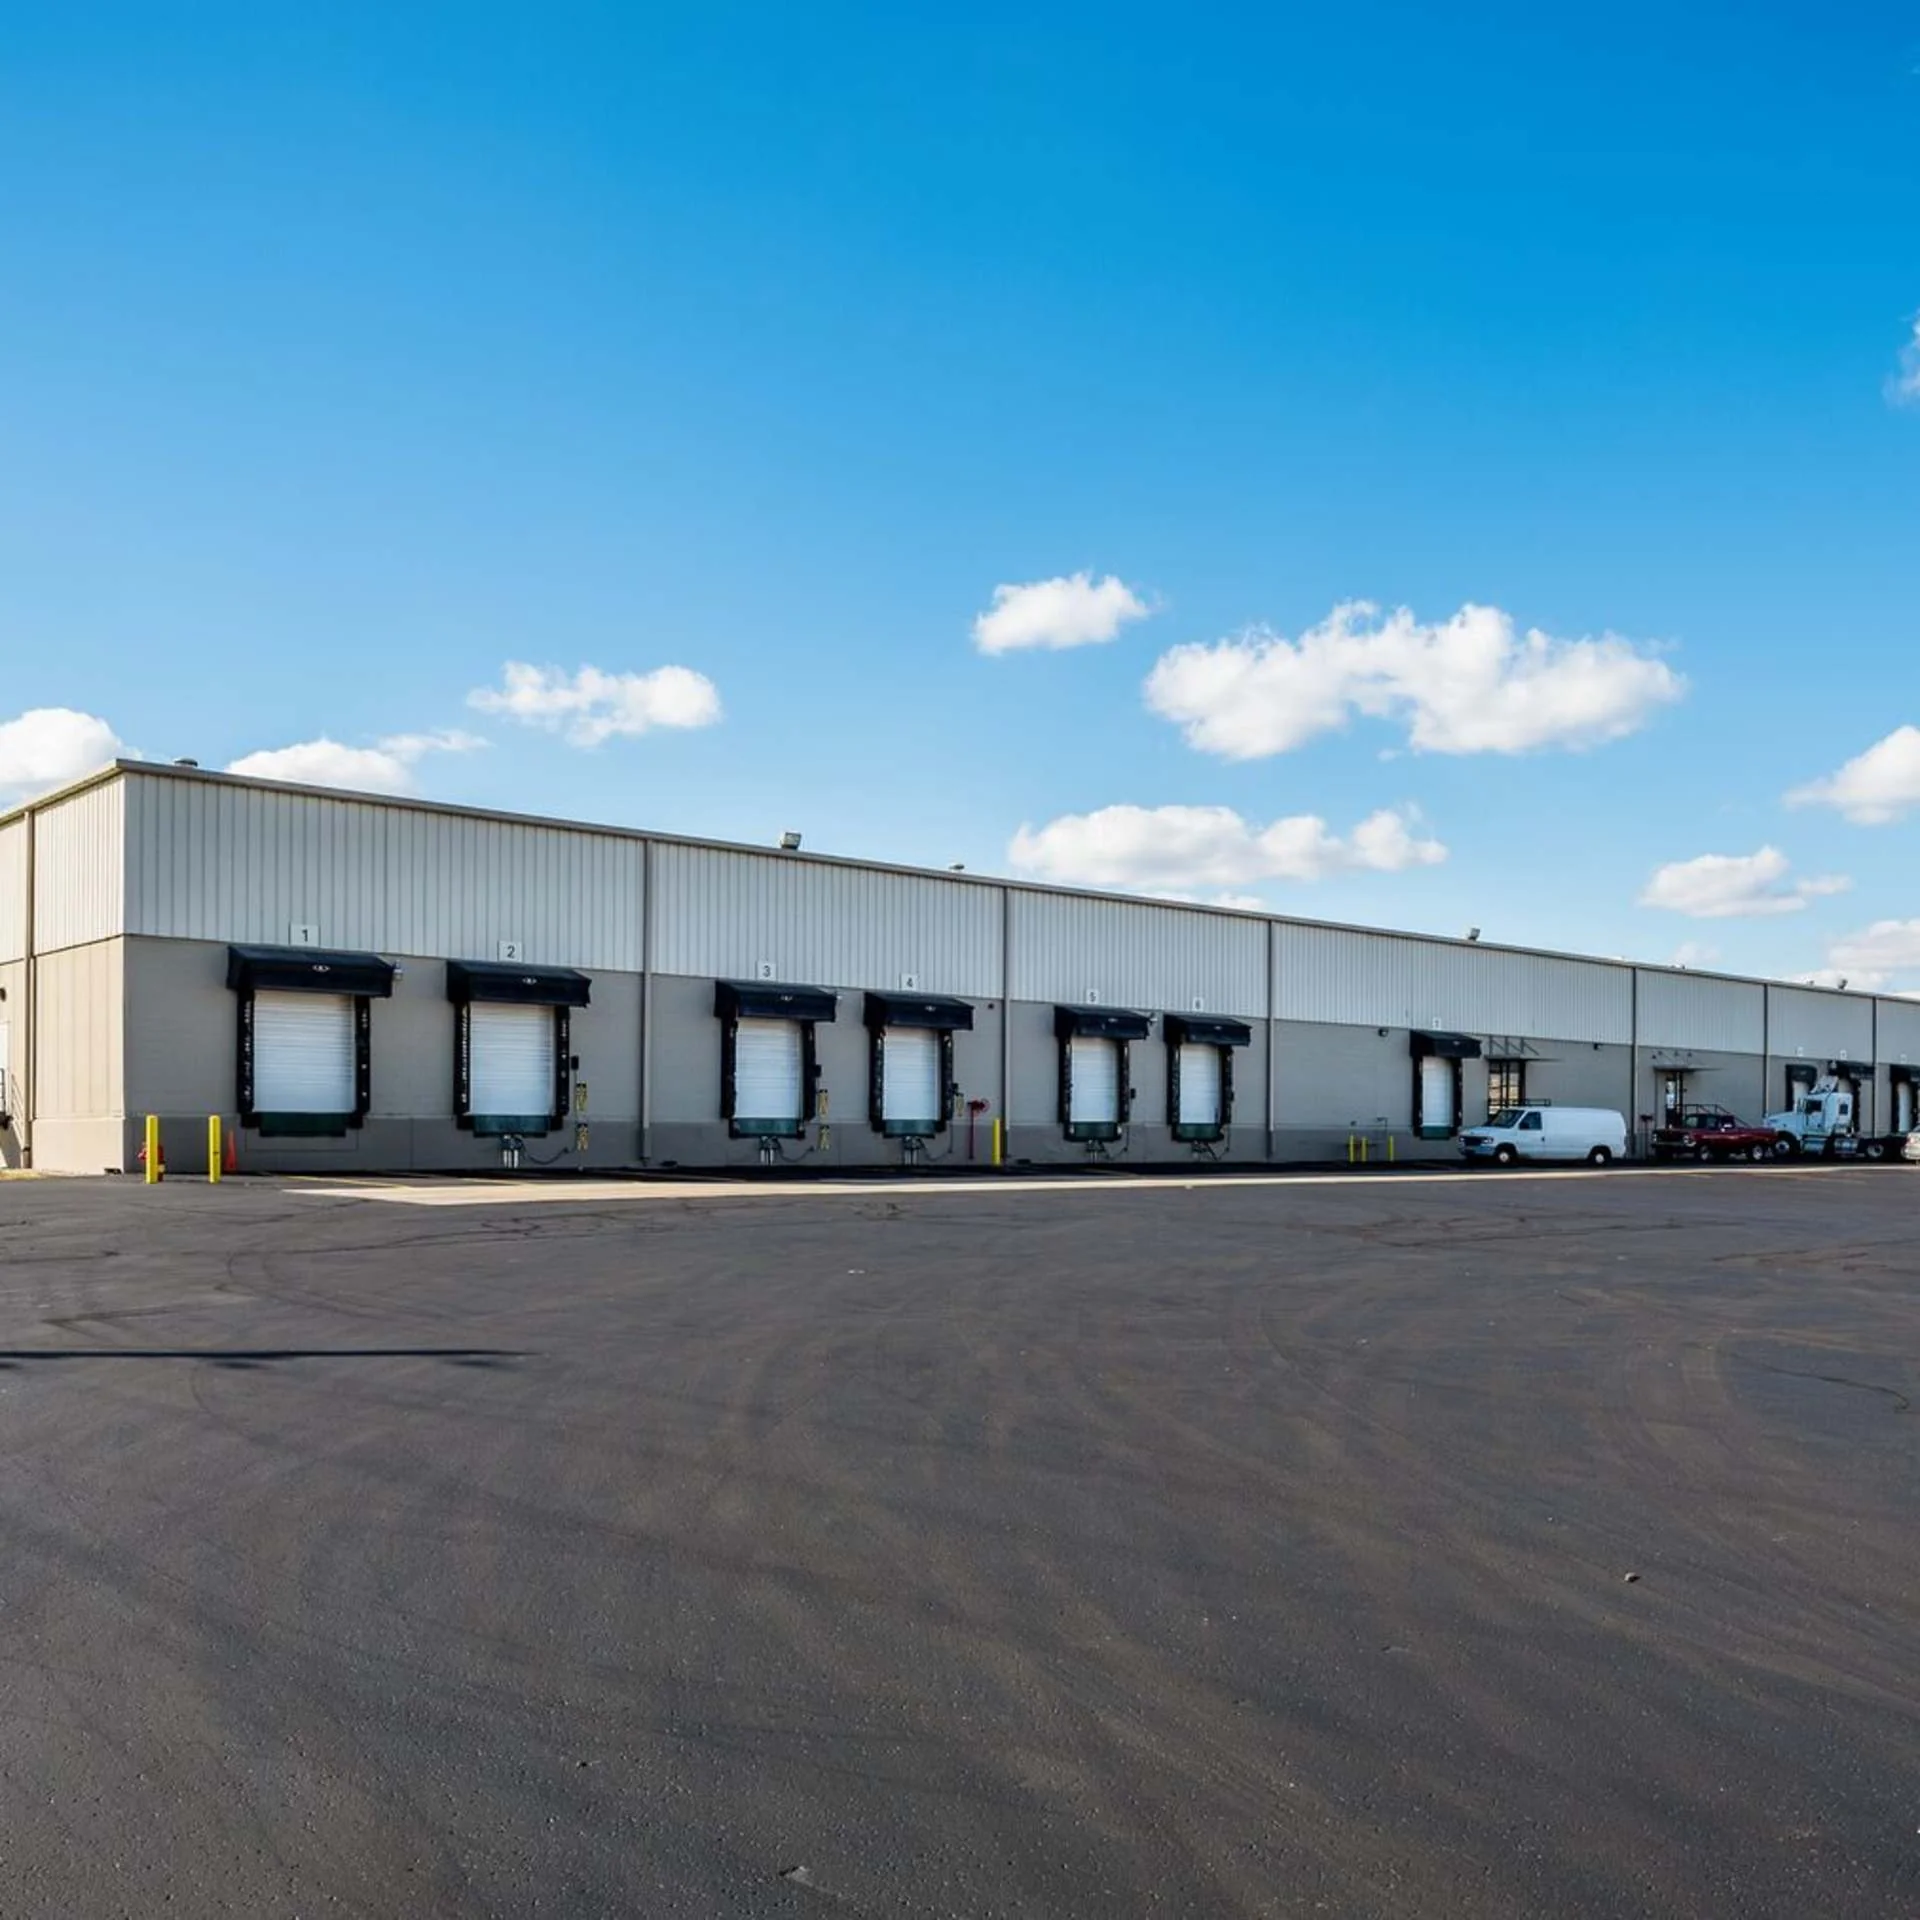
Description
Industrial | For Sublease: 19,200 - 76,800 SF 19,200 - 76,800 SF Available for Sublease Key Facts Sublease expiration date: 12/31/2027
Property description as provided by the listing source. PropZone adds independent market context, valuation estimates, and comparable listings.
Location
8145-8199 Zionsville Rd, Indianapolis, IN 46268, USA, Indianapolis, IN 46268


Market Context
As of Q1 2026, the Indianapolis industrial market showed a 7.0% vacancy rate, and average asking rents near $6.35/SF/yr. Source: multiple brokerages Q1 2026 market report.
Projected current pricing
low confidenceModeled estimate (income approach) shown as a range — not an appraisal. Projected asking rent × occupancy × net-operating-income margin band ÷ market cap rate, from Q1 2026 multiple brokerages data (cap rate 6.1%, asking rent held flat).
Compare it against other industrial listings for lease in Indianapolis, IN to benchmark pricing and space — view the full market.
Industrial market FAQ
- Is the Indianapolis industrial market tightening or softening?
- Vacancy is around 7.0% (Q1 2026).
Unified Estimate
Very Low ConfidenceRate-first confidence-weighted blend with cost-of-business adjustment.
No local comparable sales were available, so this estimate is transferred from a comparable peer market — treat it as a rough indication only. Transferred from peer market tampa (similarity: 100%) with 4 comparable listings.
Lease Rate & Market Trend
Market report quarterly trend fallback
- Avg Rent ($/SF/mo) (market data)
- Vacancy %
Investment Analysis
Beta Feature: Investment Analysis is currently in beta testing. Metrics are calculated based on available financial data and market comparables. Results are for informational purposes and should not be considered financial advice. Verify all assumptions and consult with a financial advisor before making investment decisions.
Insufficient financial data for full analysis. Add more financial fields to improve metric coverage.
Market Employment Trend
December 2025 • Source: BLS QCEW
Economic Indicators
Source: FRED
Market Demographics
Census ACS 20242024 American Community Survey 5-Year Estimates •Released annually by U.S. Census Bureau
Assumptions
- Market comparison: industrial in Indianapolis, IN
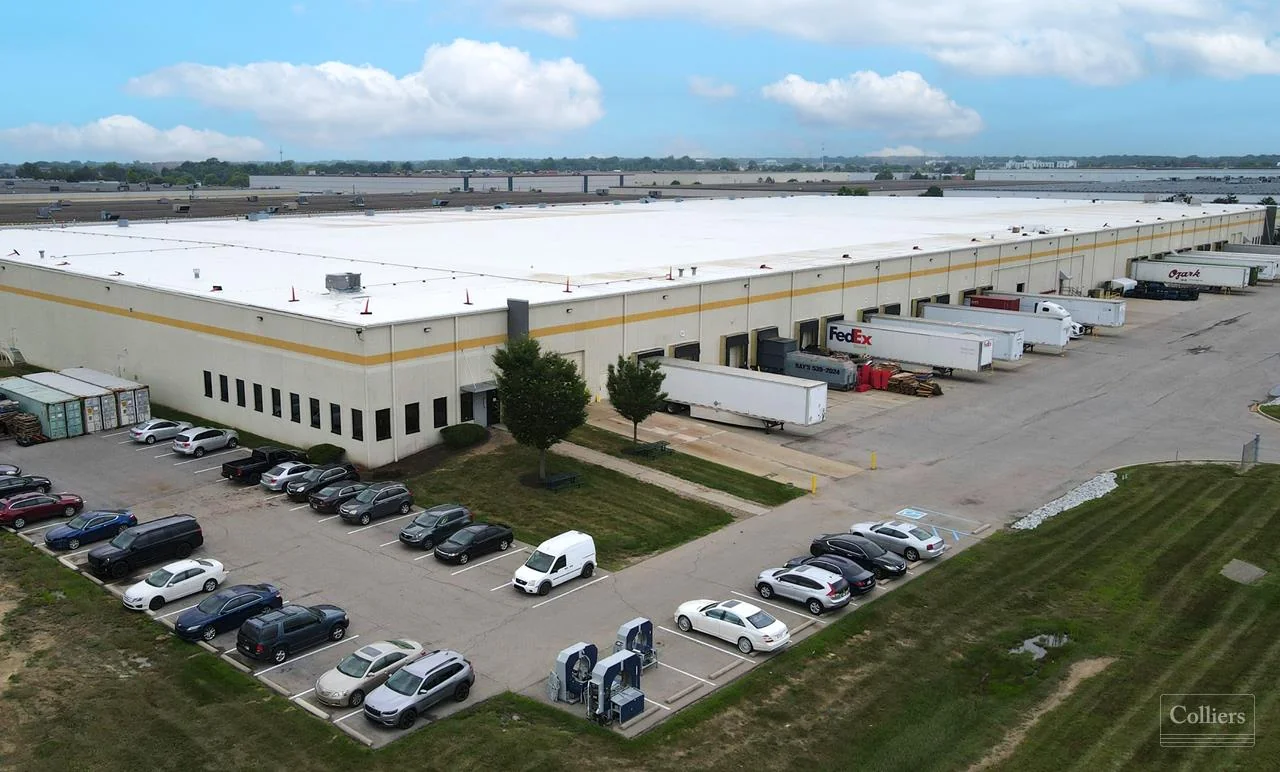
More Industrial for Lease in Indianapolis, IN(5)
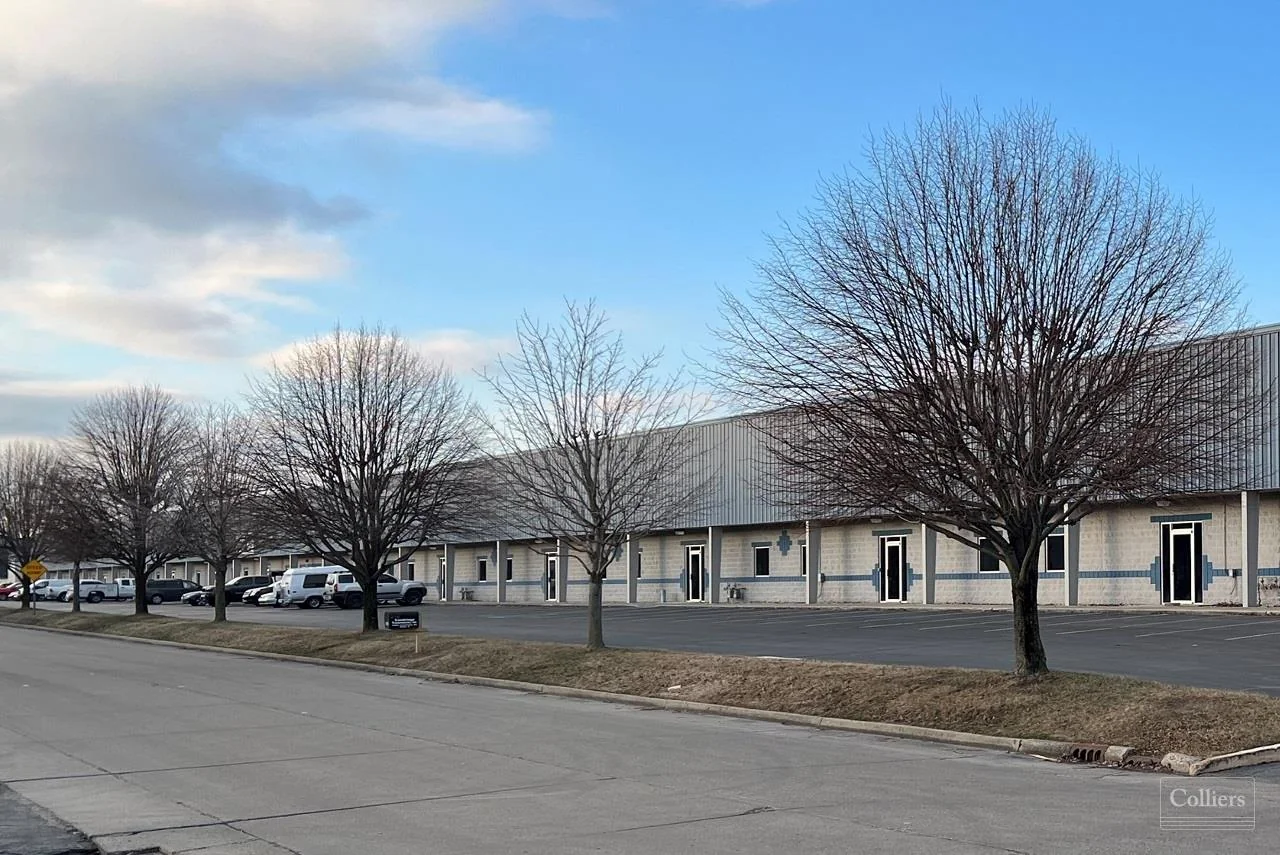
Space Available at Gateway South Industrial Park
Indianapolis, IN
Price on request
Cap Rate
N/A
Price/SF
N/A
SF
N/A
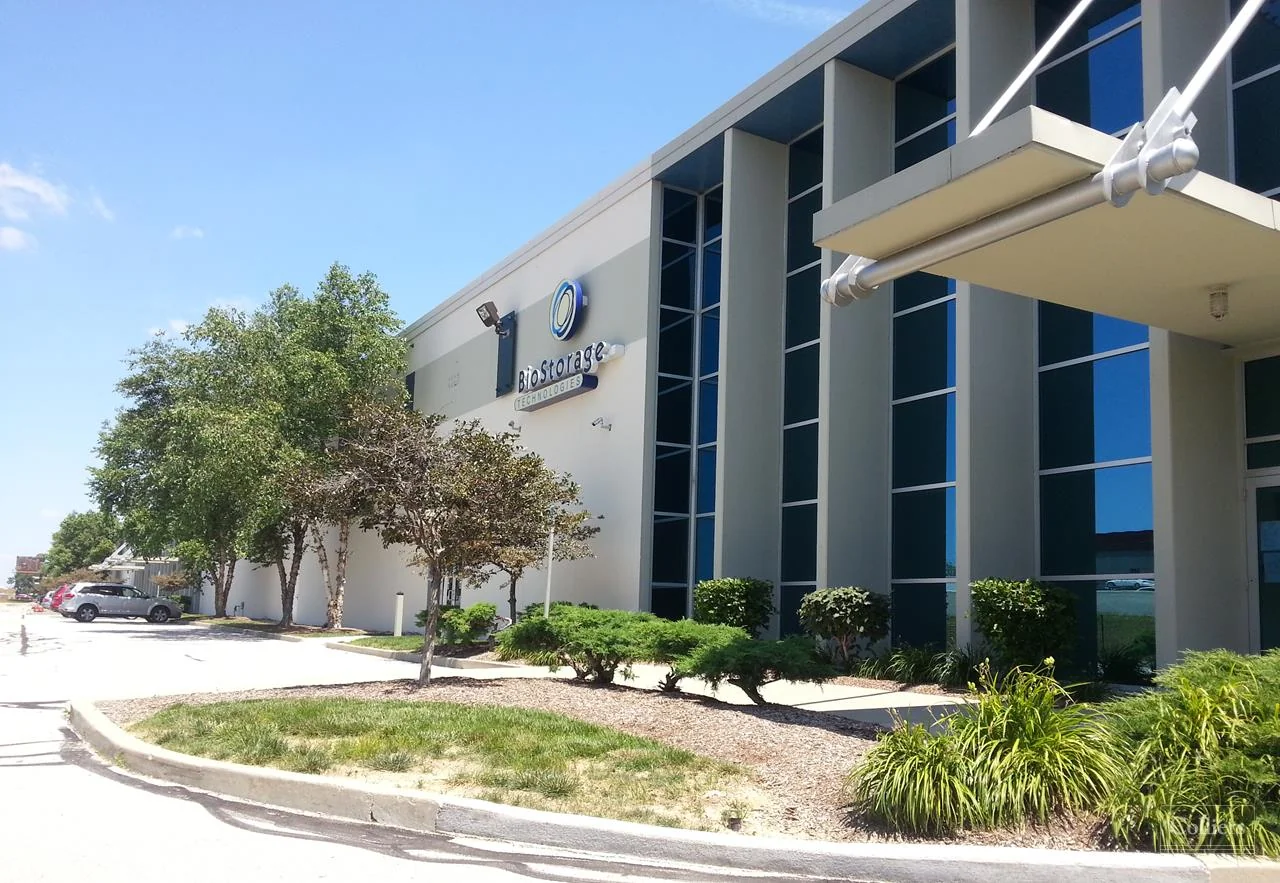
Park Fletcher Building 40
Indianapolis, IN
Price on request
Cap Rate
N/A
Price/SF
N/A
SF
N/A
Park 100 Building 95
Indianapolis, IN
Price on request
Cap Rate
N/A
Price/SF
N/A
SF
N/A
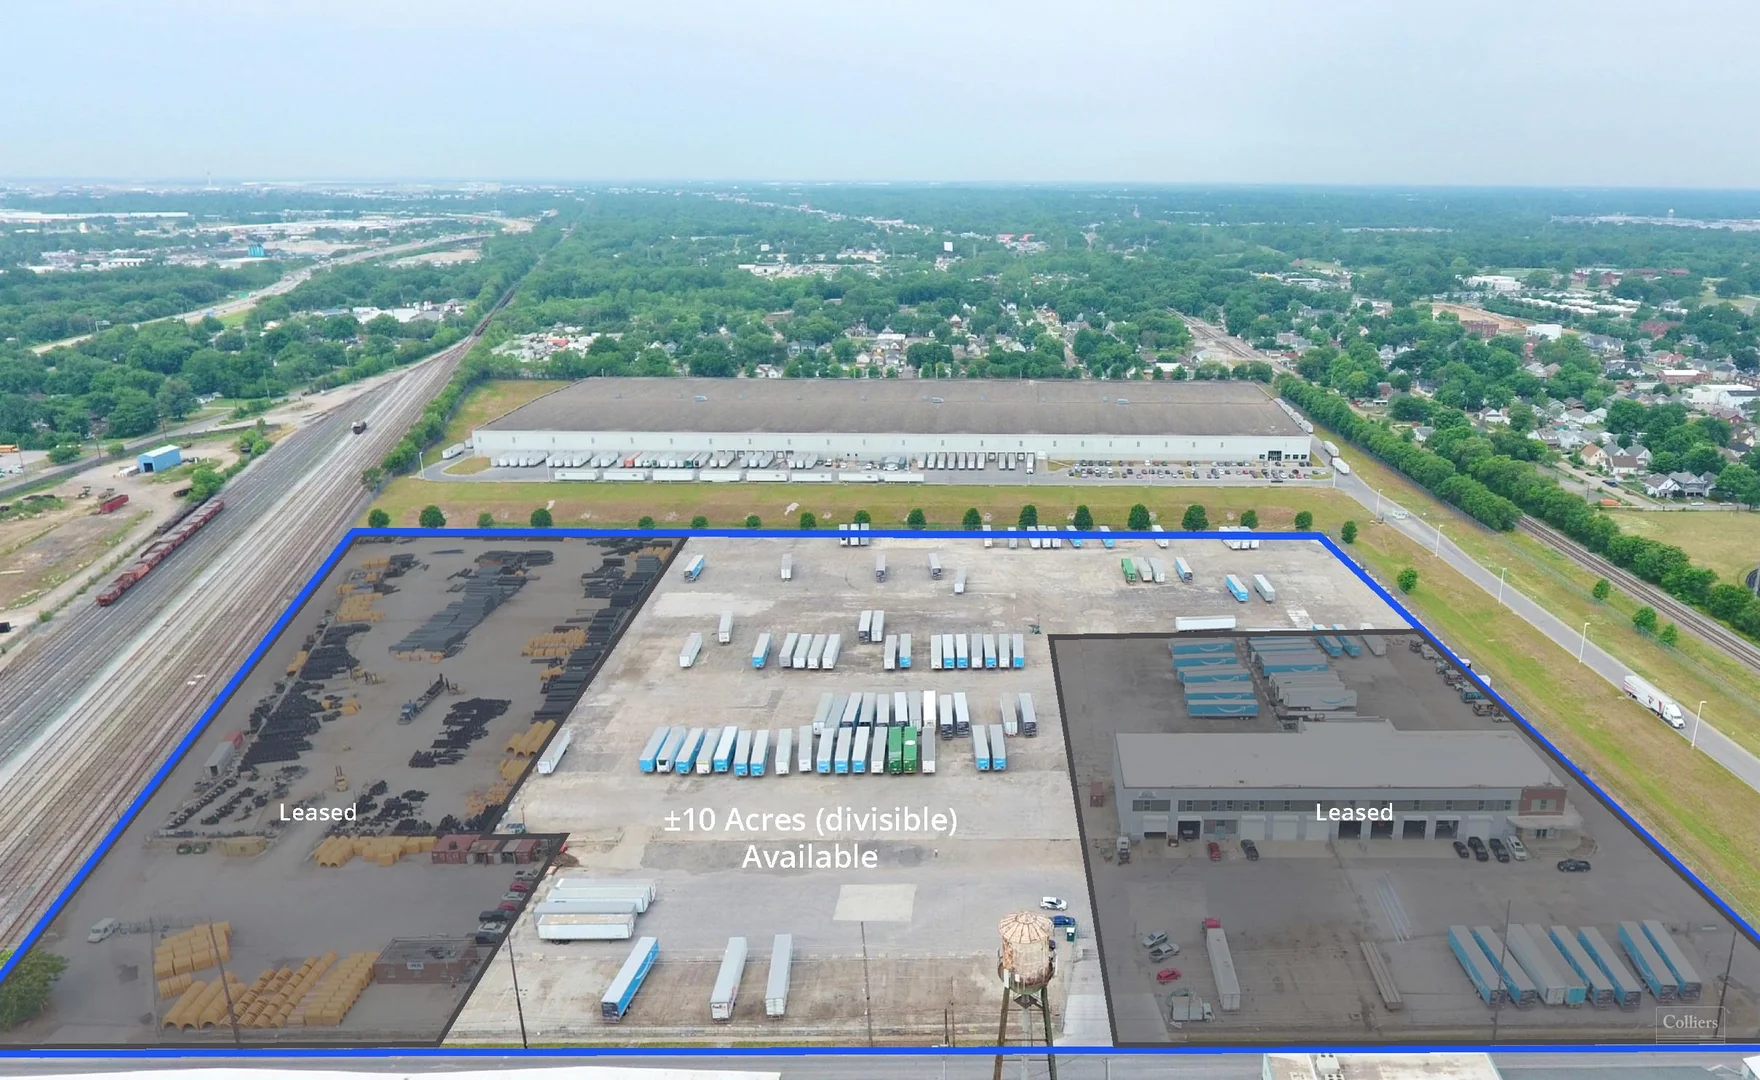
±10.00 acres Available for Sublease on ±20.50 Acres
Indianapolis, IN
Price on request
Cap Rate
N/A
Price/SF
N/A
SF
N/A
Park 100 Building 22
indianapolis, IN
Price on request
Cap Rate
N/A
Price/SF
N/A
SF
N/A
Contact Broker
Jason Speckman
Billy Powers
Broker 3
Broker 4
Listed by
Colliers Import