Industrial in Pittsburgh, PA
Price
Price on request
Market rate estimate — not broker-provided
Cost-of-Business Details
Very Low ConfidenceTransferred from peer market tulsa (similarity: 100%) with 4 comparable listings.
| Component | Value | Detail | Source |
|---|---|---|---|
| Base Rent | $2.00/SF | — | peer_city_transfer |
| Utilities | — | 7.8¢/kWh | OpenEI URDB |
| Property Tax | — | 0.0% eff. rate | API Ninjas |
| Labor Index | — | $1512/wk | BLS QCEW |
Source Provenance (1)
| Source | Type | Count | Year | Freshness | Peer |
|---|---|---|---|---|---|
| Peer City Transfer | economic_similarity | 4 | — | real-time | tulsa (100%) |
Description
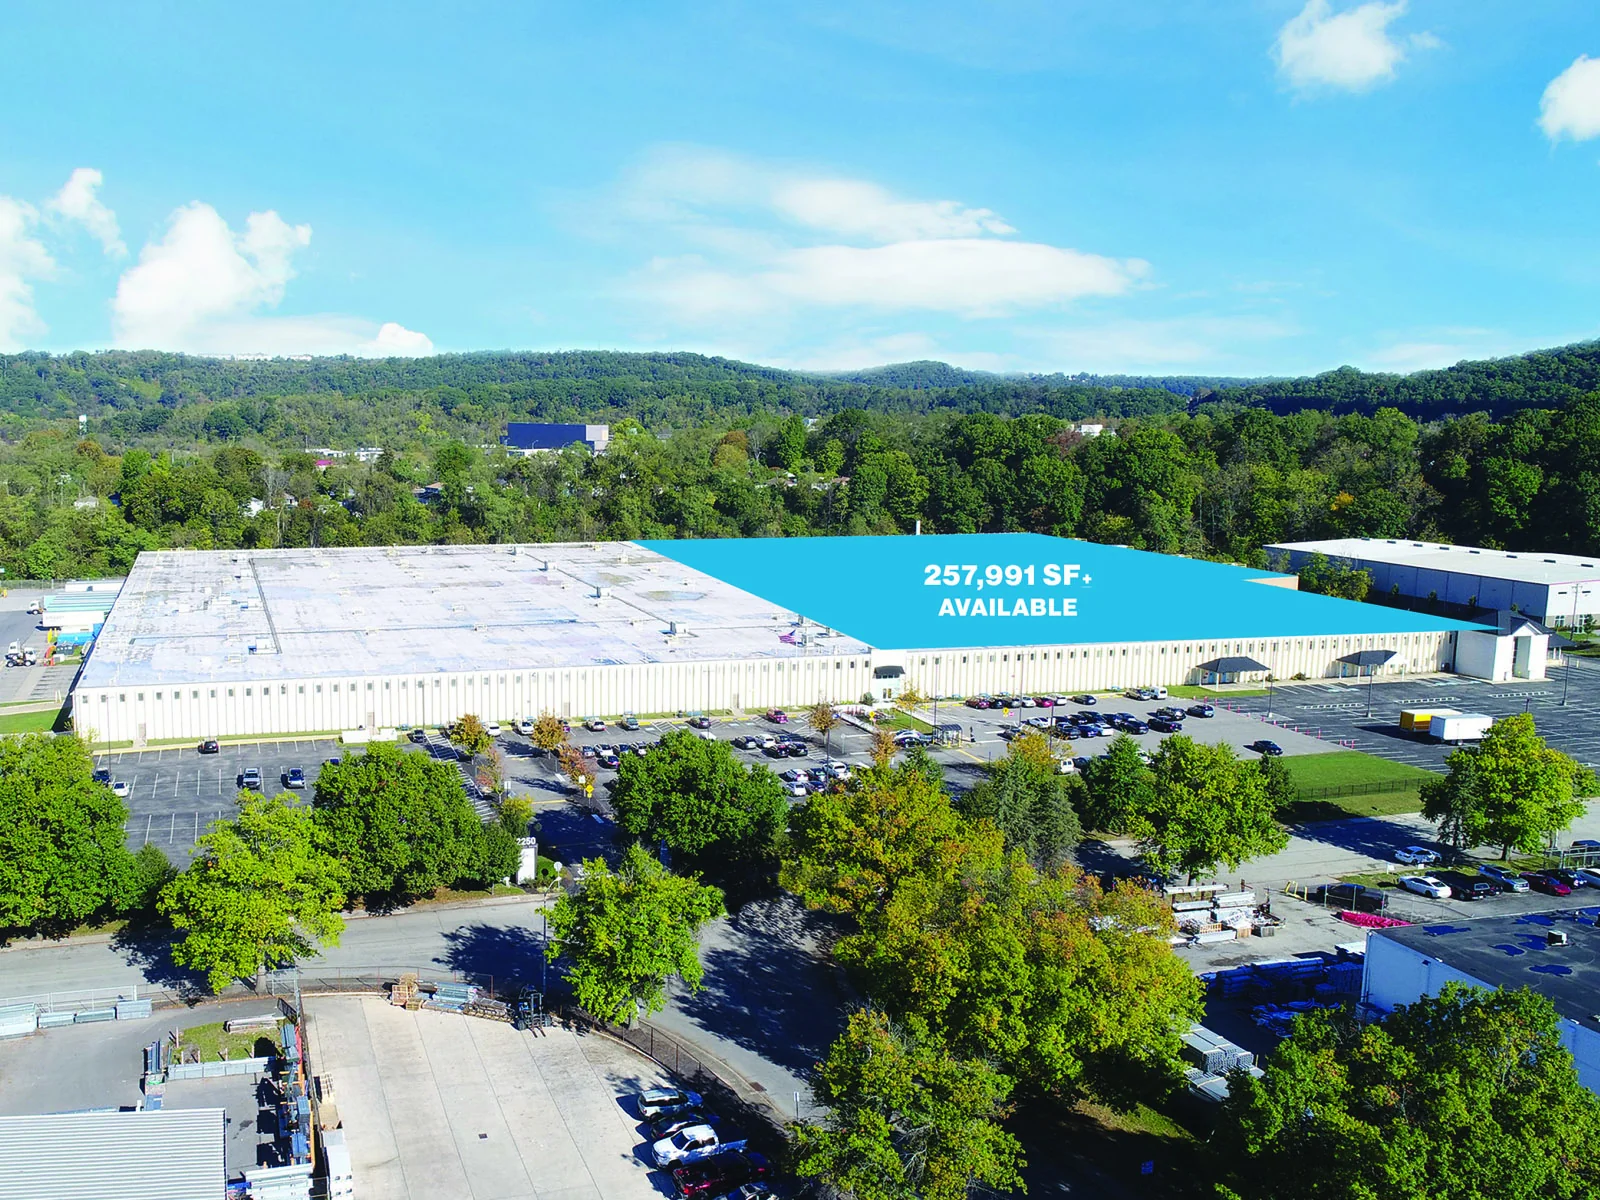
257,991 SF Available - Industrial Facility 2250 Roswell Drive is a premier industrial facility in Pittsburgh with easy access to the I-79 and I-376 interchange and only 5 miles from downtown Pittsburgh via multiple routes.
Property description as provided by the listing source. PropZone adds independent market context, valuation estimates, and comparable listings.


Market Context
As of Q1 2026, the Pittsburgh industrial market showed a 6.3% vacancy rate, average asking rents near $7.74/SF/yr, and cap rates around 5.0%. Source: multiple brokerages Q1 2026 market report.
Projected current pricing
high confidenceModeled estimate (income approach) shown as a range — not an appraisal. Projected asking rent × occupancy × net-operating-income margin band ÷ market cap rate, from Q1 2026 multiple brokerages data (cap rate 5.0%, asking rent held flat).
Compare it against other industrial listings for sale in Pittsburgh, PA to benchmark pricing and space — view the full market.
Industrial market FAQ
- What is the typical cap rate for industrial in Pittsburgh?
- About 5.0% as of Q1 2026, per multiple brokerages.
- Is the Pittsburgh industrial market tightening or softening?
- Vacancy is around 6.3% (Q1 2026).
Unified Estimate
Very Low ConfidenceRate-first confidence-weighted blend with cost-of-business adjustment.
No local comparable sales were available, so this estimate is transferred from a comparable peer market — treat it as a rough indication only. Transferred from peer market tulsa (similarity: 100%) with 4 comparable listings.
Sale Price History
2012 – 2026 · county sold comps + market trendsFIPS 42003
- Avg Rent ($/SF/yr) (market data)
- Vacancy %
Investment Analysis
Beta Feature: Investment Analysis is currently in beta testing. Metrics are calculated based on available financial data and market comparables. Results are for informational purposes and should not be considered financial advice. Verify all assumptions and consult with a financial advisor before making investment decisions.
Financing Assumptions
Insufficient financial data for full analysis. Add more financial fields to improve metric coverage.
Market Employment Trend
December 2025 • Source: BLS QCEW
Economic Indicators
Source: FRED
Market Demographics
Census ACS 20242024 American Community Survey 5-Year Estimates •Released annually by U.S. Census Bureau
Assumptions
- Interest rate: 6.47% (FRED live)
- Loan term: 25 years
- Down payment: 25.0%
- Market comparison: industrial in pittsburgh, PA
More Industrial for Sale in Pittsburgh, PA(5)
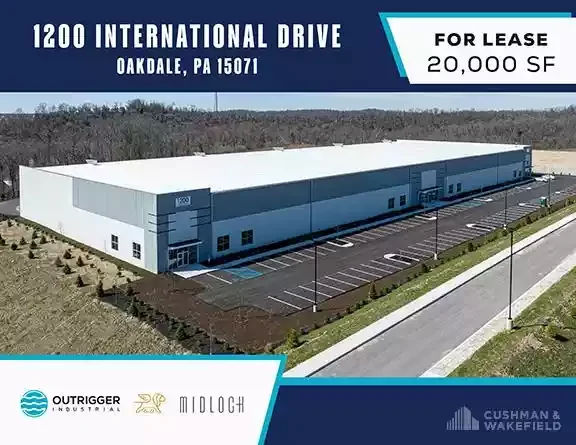
1200 International Dr
Pittsburgh, PA
Price on request
Cap Rate
N/A
Price/SF
N/A
SF
100.0K
FOR SALE | Tech/Flex Opportunity in Pittsburgh’s Dynamic Parkway West Corridor
Pittsburgh, PA
Price on request
Cap Rate
N/A
Price/SF
N/A
SF
N/A
Industrial in Pittsburgh, PA
pittsburgh, PA
Price on request
Cap Rate
N/A
Price/SF
N/A
SF
N/A
1200 International Dr
pittsburgh, PA
Price on request
Cap Rate
N/A
Price/SF
N/A
SF
100.0K
650 Mansfield Ave
pittsburgh, PA
Price on request
Cap Rate
N/A
Price/SF
N/A
SF
N/A
Documents
Contact Broker

Kim Clackson

Matt Clackson
Listed by
CBRE System Import