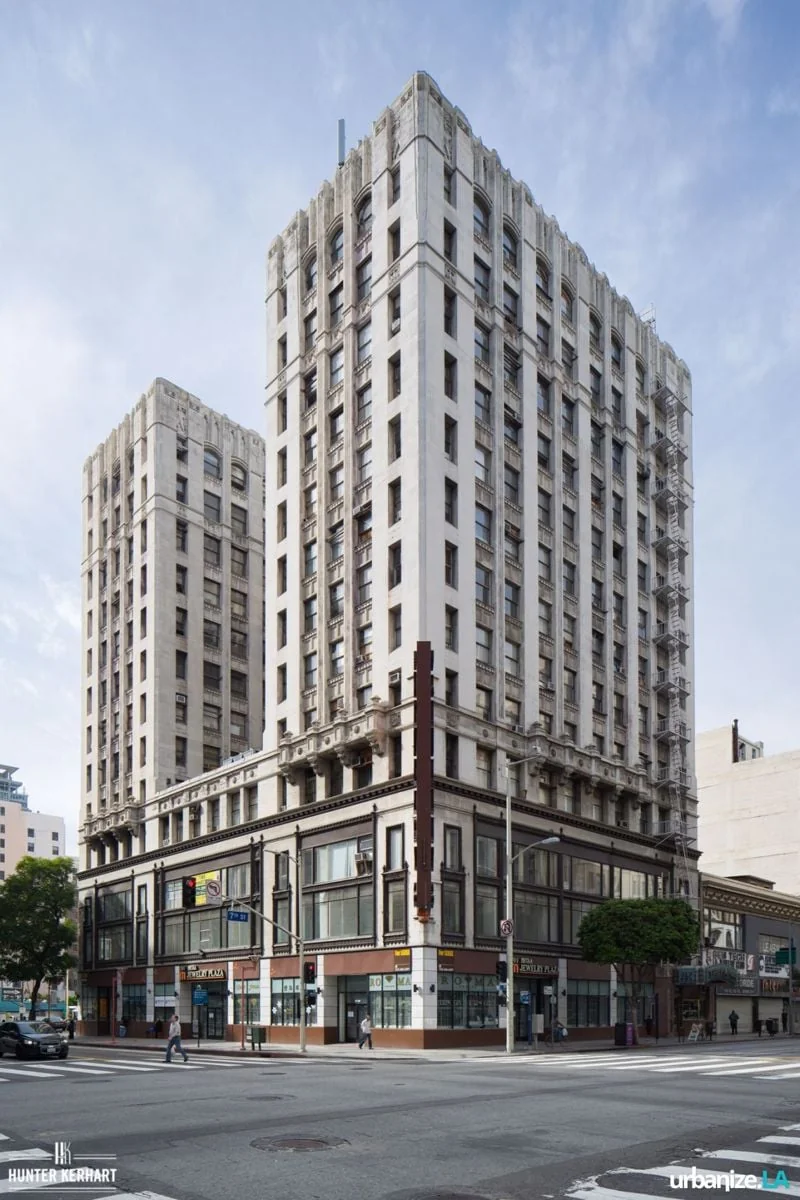
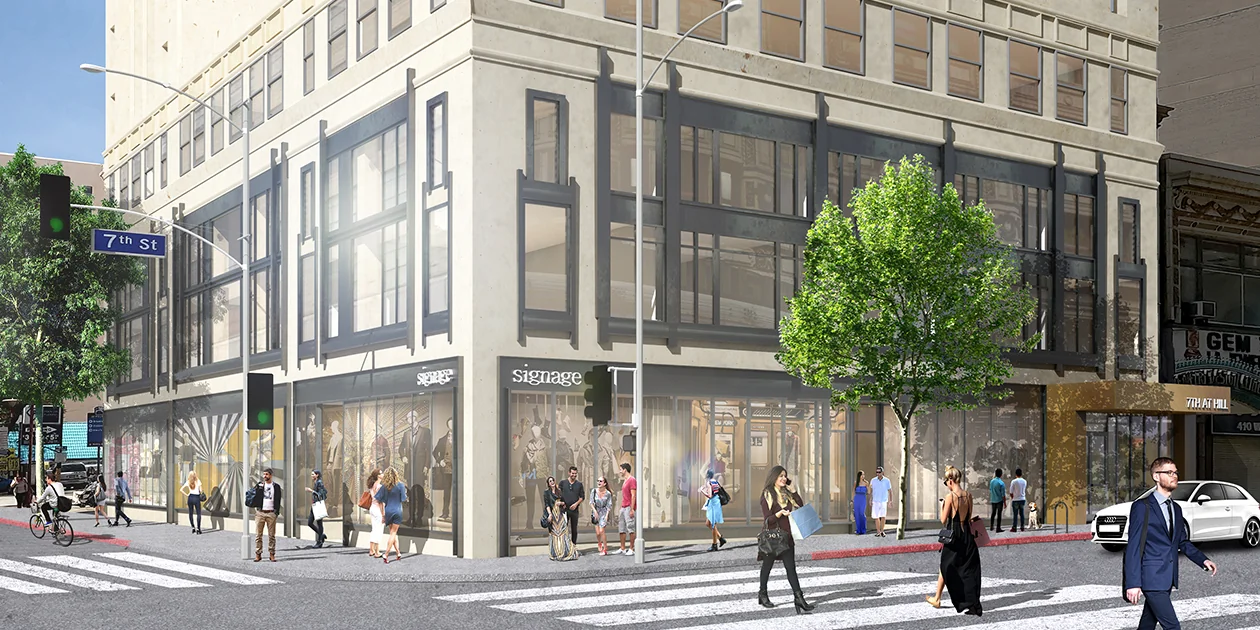
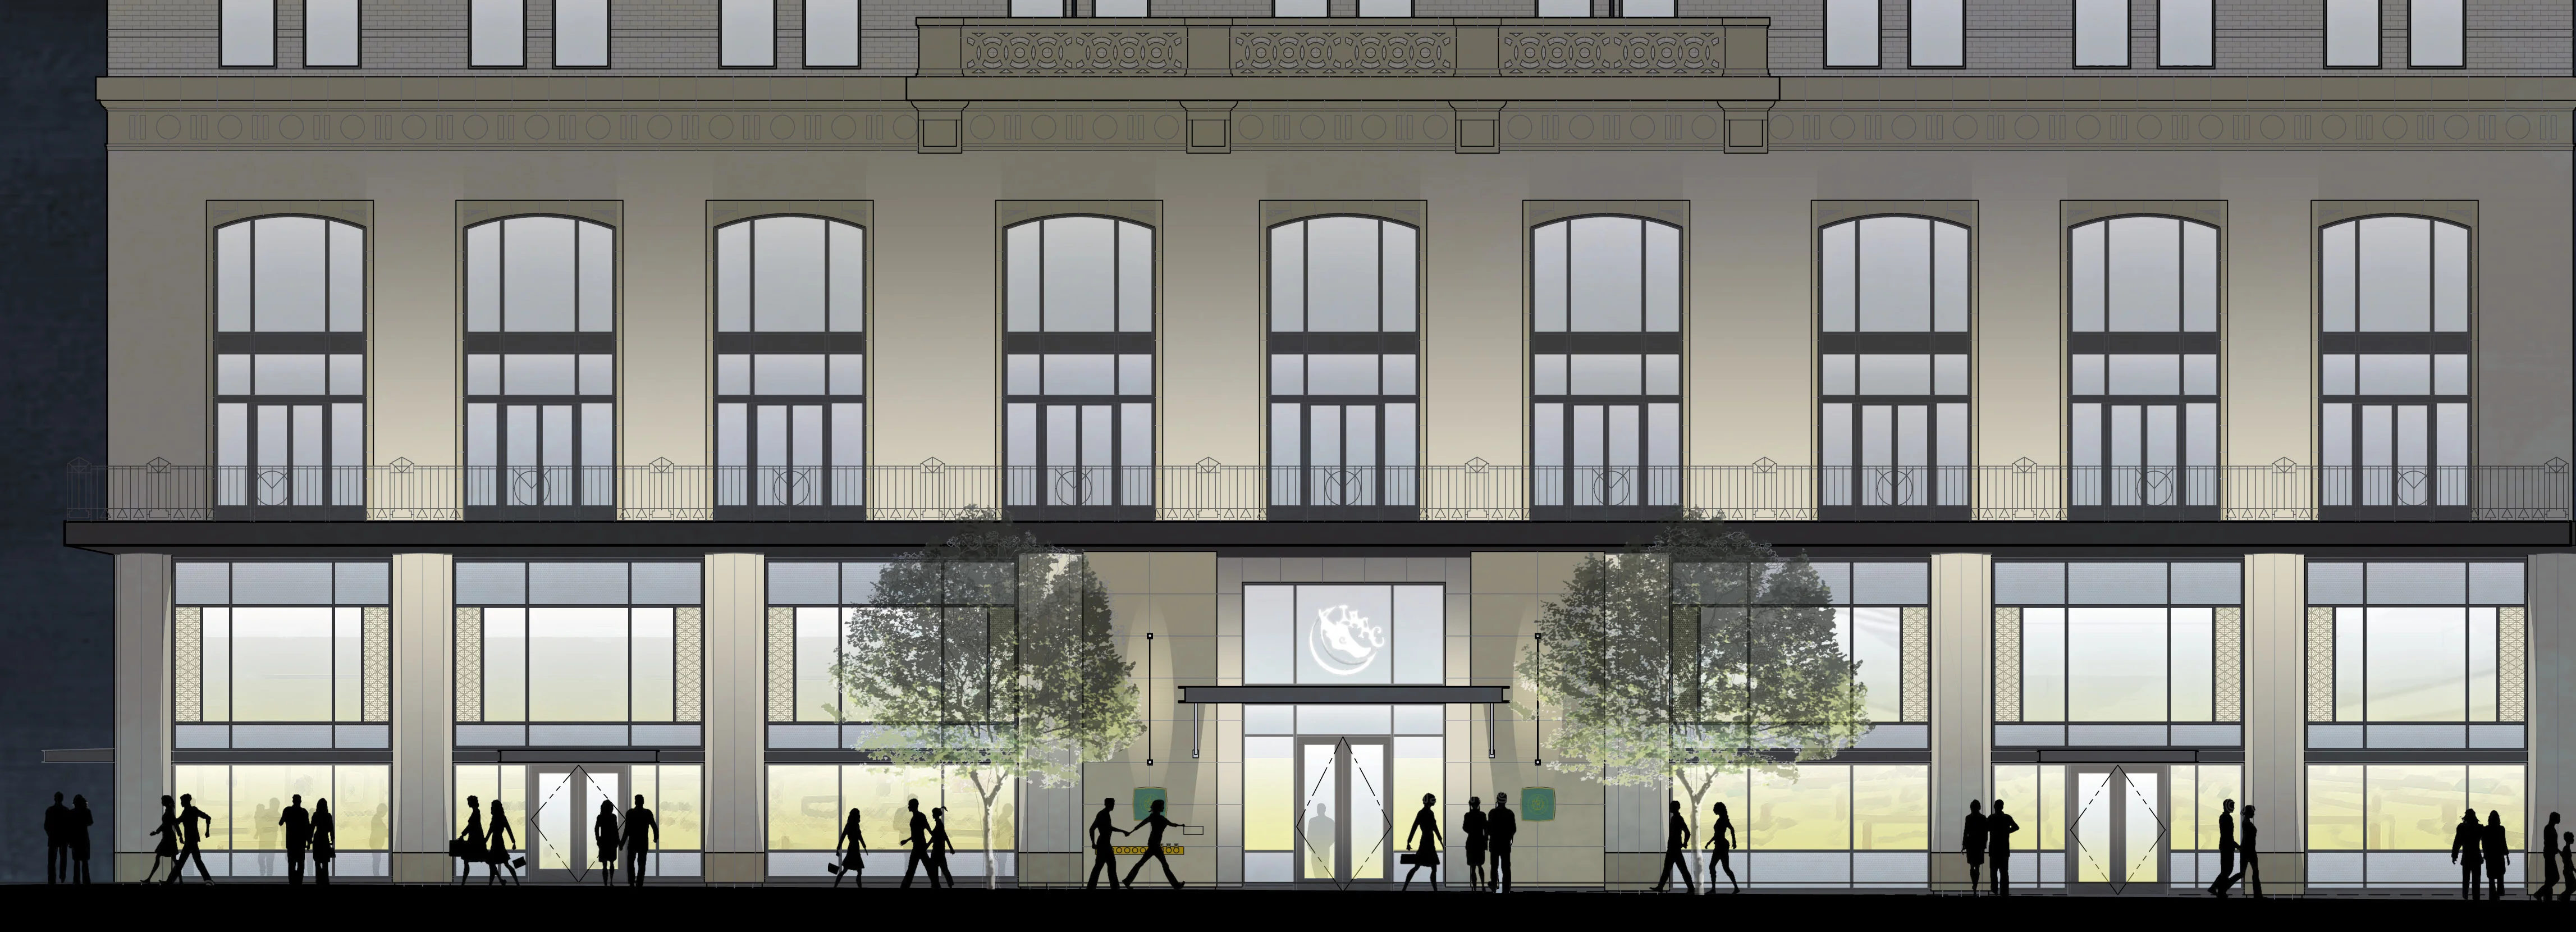
Foreman & Clark
Price
Price on request
Price/Sq Ft
$6.50
Description
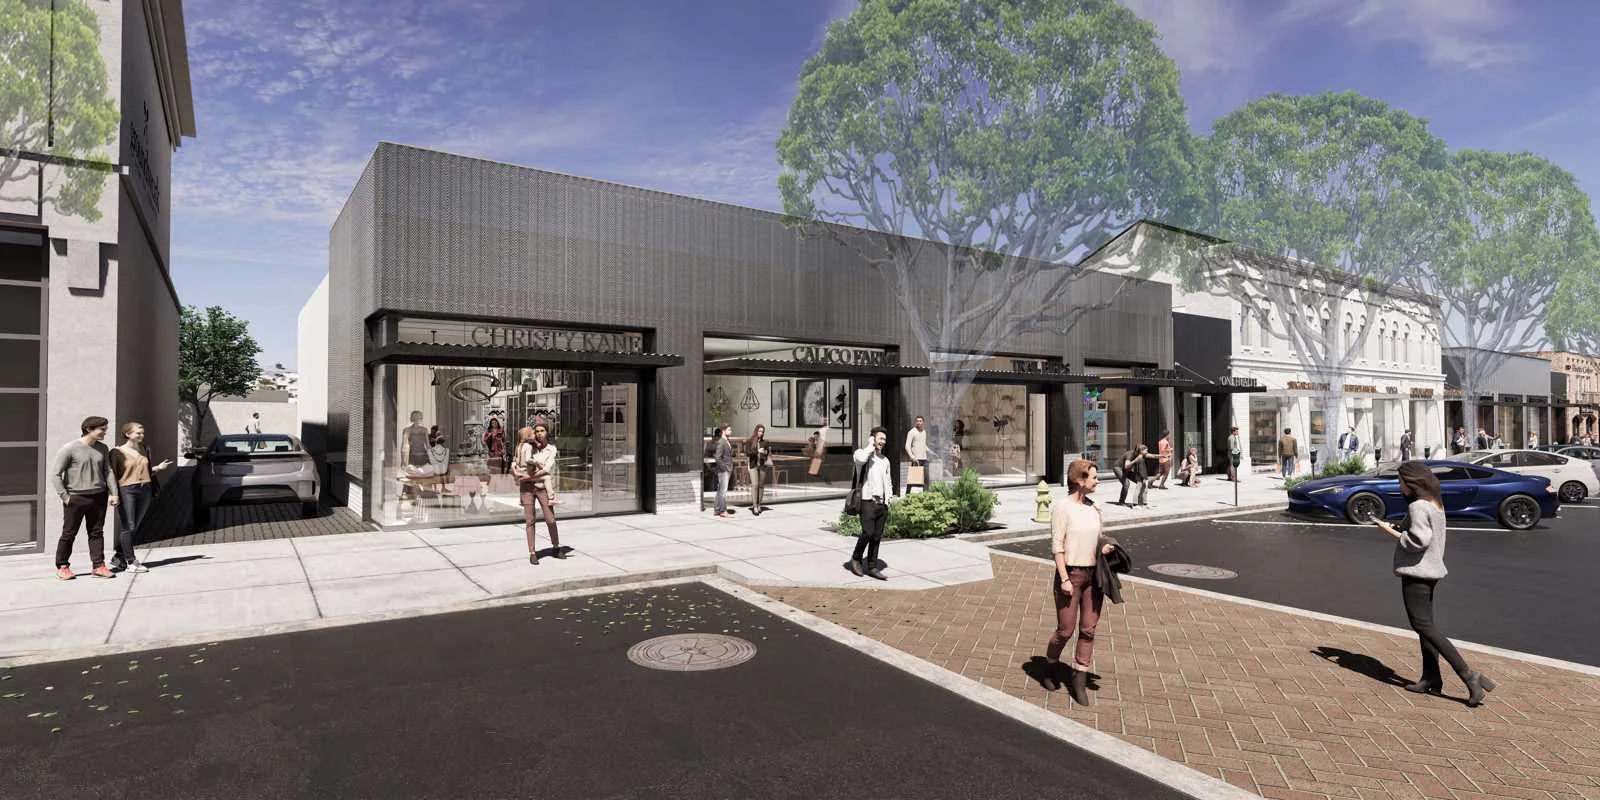
Retail On Downtown's Famed 7th Street The historic Foreman & Clark Building features prominent retail space at the corner of 7th/Hill, on one of Downtown’s main retail corridors. Vancouver-based real estate firm Bonnis Properties is currently restoring the building’s original façade, creating a beautiful landmark for Downtown LA. When complete, the building will feature approximately 124 residential units above the ground level retail space. 7th Street has historically been known as one of Downtown’s premier retail streets, and users such as Bottega Louie, Uniqlo, and PK Market are helping usher in the next phase.
Property description as provided by the listing source. PropZone adds independent market context, valuation estimates, and comparable listings.


Financial Details
Market Context
As of Q3 2023, the Greater Los Angeles retail market showed rents up 0.5% year over year, and cap rates around 5.0%. Source: multiple brokerages Q3 2023 market report.
Projected current pricing
low confidenceModeled estimate (income approach) shown as a range — not an appraisal. Projected asking rent × occupancy × net-operating-income margin band ÷ market cap rate, from Q4 2025 www matthews com data (cap rate 7.2%, asking rent trend-adjusted to today).
Compare it against other retail listings for lease in Los Angeles, CA to benchmark pricing and space — view the full market.
Retail market FAQ
- What is the typical cap rate for retail in Greater Los Angeles?
- About 5.0% as of Q3 2023, per multiple brokerages.
Unified Estimate
Medium ConfidenceRate-first confidence-weighted blend with cost-of-business adjustment.
Lease Rate & Market Trend
2000 – 2025 · county sold comps + market trendsFIPS 06037
- Median $/SF (sold)
Investment Analysis
Beta Feature: Investment Analysis is currently in beta testing. Metrics are calculated based on available financial data and market comparables. Results are for informational purposes and should not be considered financial advice. Verify all assumptions and consult with a financial advisor before making investment decisions.
Market Employment Trend
December 2025 • Source: BLS QCEW
Economic Indicators
Source: FRED
Market Demographics
Census ACS 20242024 American Community Survey 5-Year Estimates •Released annually by U.S. Census Bureau
Sold Comps
Q1 2026Source: los_angeles_assessor · County FIPS: 06037
Rent vs. Market
$9.75
33.8% above market average
Listed at $9.75/sqft/mo vs. market avg $7.29/sqft/mo
Assumptions
- Market comparison: retail in los angeles, CA
More Retail for Lease in Los Angeles, CA(5)
Property in Unknown, XX
Los Angeles, CA
$5.00M
Cap Rate
N/A
Price/SF
5.0/sf
SF
N/A
The Foreman & Clark Building
los angeles, CA
Price on request
Cap Rate
N/A
Price/SF
6.5/sf
SF
N/A
7th & Olive
los angeles, CA
Price on request
Cap Rate
N/A
Price/SF
6.5/sf
SF
N/A

Brentwood Town Center
los angeles, CA
Price on request
Cap Rate
N/A
Price/SF
6.0/sf
SF
N/A
Larchmont Mercantile
los angeles, CA
Price on request
Cap Rate
N/A
Price/SF
4.3/sf
SF
N/A