Centennial Yards
Price
Price on request
Market rate estimate — not broker-provided
Cost-of-Business Details
Very Low ConfidenceTransferred from peer market richmond (similarity: 100%) with 3 comparable listings.
| Component | Value | Detail | Source |
|---|---|---|---|
| Base Rent | $184.71/SF | — | peer_city_transfer |
| Utilities | — | 11.2¢/kWh | OpenEI URDB |
| Property Tax | — | 0.0% eff. rate | API Ninjas |
| Labor Index | — | $1605/wk | BLS QCEW |
Source Provenance (1)
| Source | Type | Count | Year | Freshness | Peer |
|---|---|---|---|---|---|
| Peer City Transfer | economic_similarity | 3 | — | real-time | richmond (100%) |
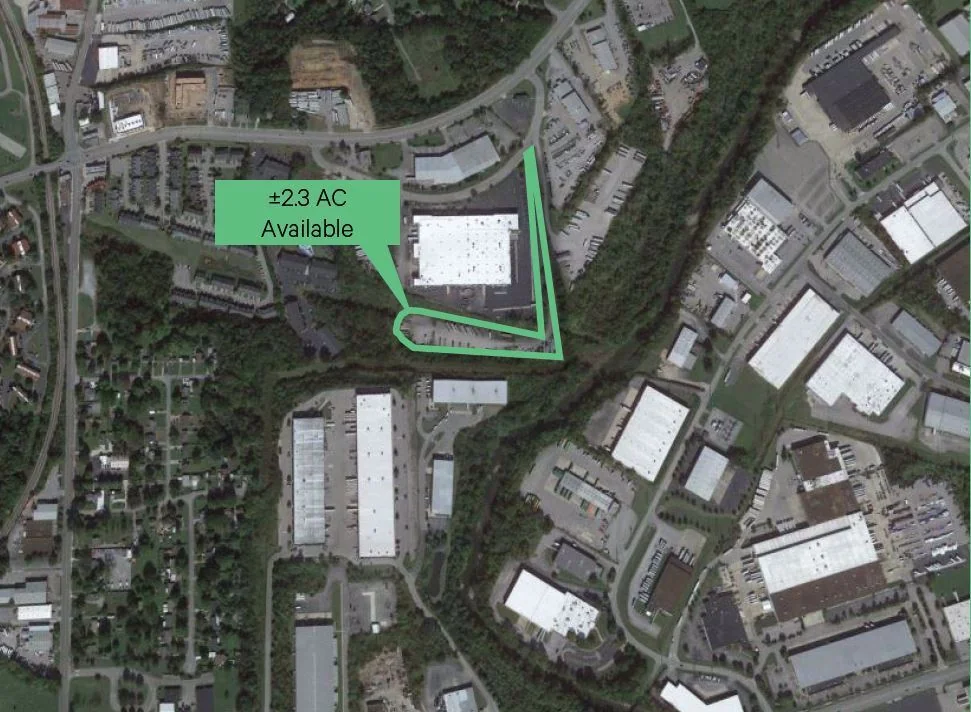
Description
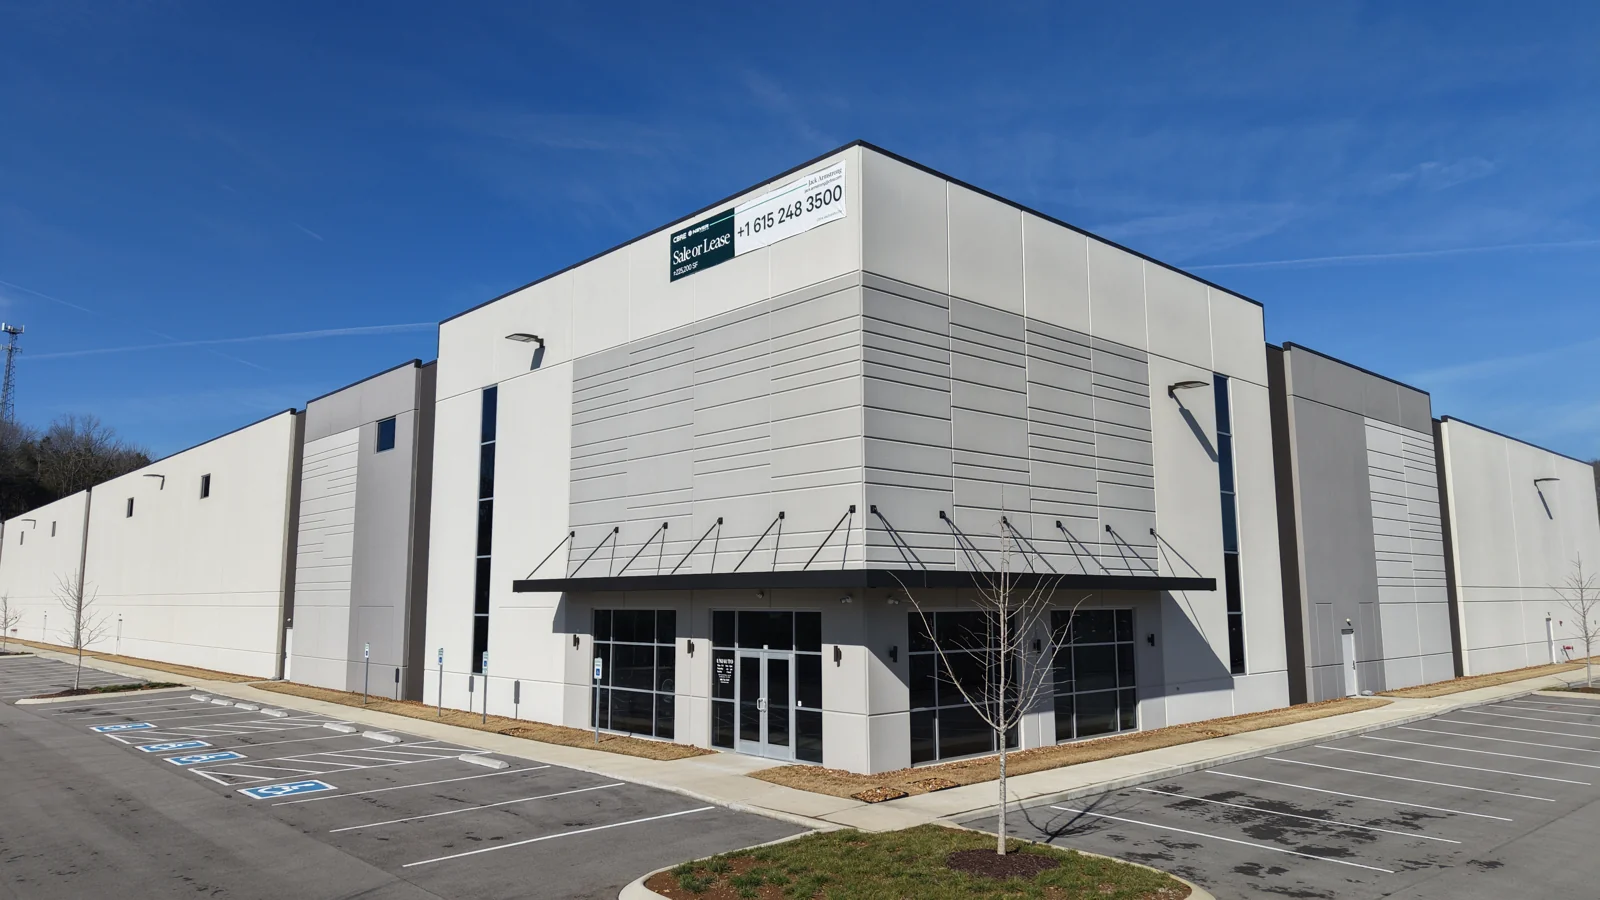
±16.75 AC IOS Site For Lease - Demising Plans Available
Property description as provided by the listing source. PropZone adds independent market context, valuation estimates, and comparable listings.


Market Context
As of Q1 2026, the Nashville industrial market showed a 3.4% vacancy rate. Source: multiple brokerages Q1 2026 market report.
Projected current pricing
low confidenceModeled estimate (income approach) shown as a range — not an appraisal. Projected asking rent × occupancy × net-operating-income margin band ÷ market cap rate, from Q1 2026 curated:cbre data (cap rate 6.3%, asking rent held flat).
Tight vacancy keeps competition for quality space elevated.
Compare it against other industrial listings for sale in Nashville, TN to benchmark pricing and space — view the full market.
Industrial market FAQ
- Is the Nashville industrial market tightening or softening?
- Vacancy is around 3.4% (Q1 2026).
Unified Estimate
Very Low ConfidenceCost-of-business estimate only; rate estimator unavailable.
No local comparable sales were available, so this estimate is transferred from a comparable peer market — treat it as a rough indication only. Transferred from peer market richmond (similarity: 100%) with 3 comparable listings.
Sale Price History
Market report quarterly trend fallback
- Vacancy %
More Industrial for Sale in Nashville, TN(5)
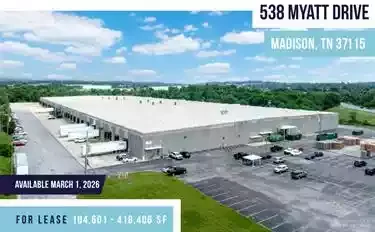
925 Cowan St.
Nashville, TN
Price on request
Cap Rate
N/A
Price/SF
N/A
SF
20.0K
Property in Unknown, XX
nashville, TN
Price on request
Cap Rate
N/A
Price/SF
N/A
SF
N/A
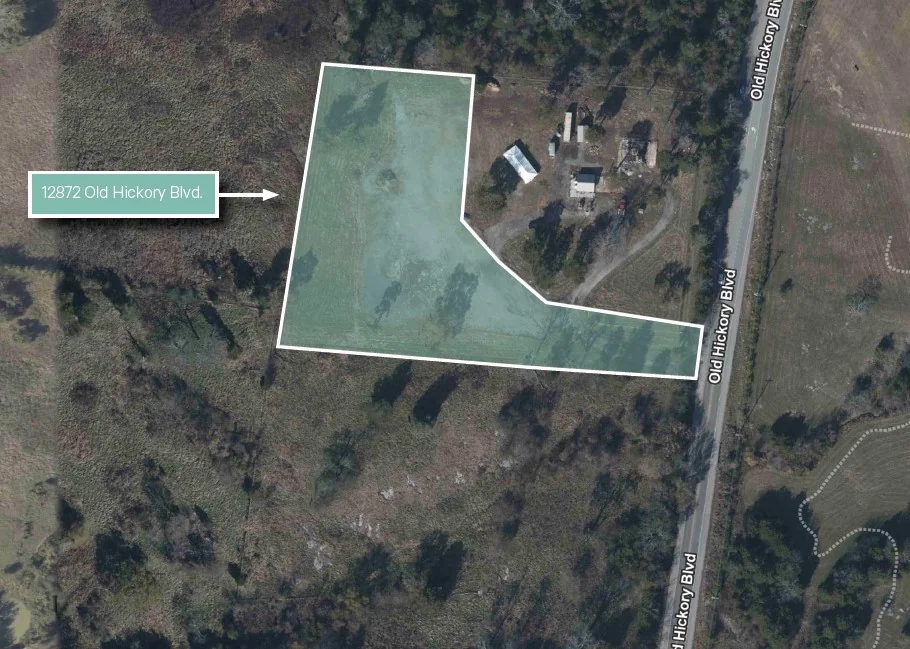
12872 Old Hickory Blvd.
nashville, TN
Price on request
Cap Rate
N/A
Price/SF
N/A
SF
N/A
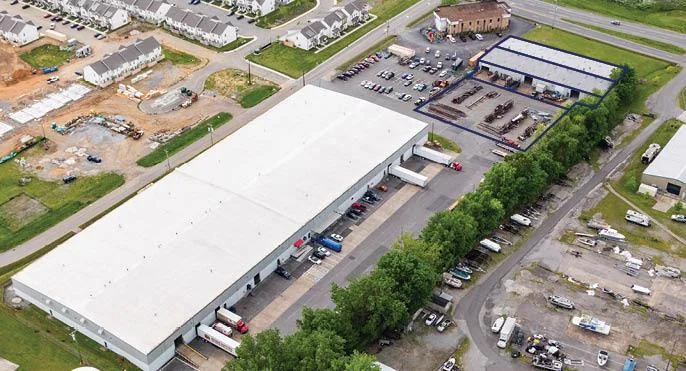
Industrial in Nashville, TN
nashville, TN
Price on request
Cap Rate
N/A
Price/SF
N/A
SF
N/A
Louisville Highway Industrial
goodlettsville, TN
Price on request
Cap Rate
N/A
Price/SF
N/A
SF
N/A