
7516 Camargo Rd
Price
Price on request
Square Feet
26,565
Market rate estimate — not broker-provided
Cost-of-Business Details
Medium ConfidenceEstimated from market cap rate (8.6%), property tax rate (0.02%), and wage-adjusted baseline.
| Component | Value | Detail | Source |
|---|---|---|---|
| Base Rent | $14.00/SF | — | tax_cap_reverse |
| Utilities | — | 14.7¢/kWh | OpenEI URDB |
| Property Tax | — | 0.0% eff. rate | API Ninjas |
| Labor Index | — | $1467/wk | BLS QCEW |
Source Provenance (3)
| Source | Type | Count | Year | Freshness | Peer |
|---|---|---|---|---|---|
| Market Reports | cap_rate | — | — | quarterly | — |
| API Ninjas | property_tax | — | — | annual | — |
| BLS QCEW | wage_index | — | — | quarterly | — |
Description
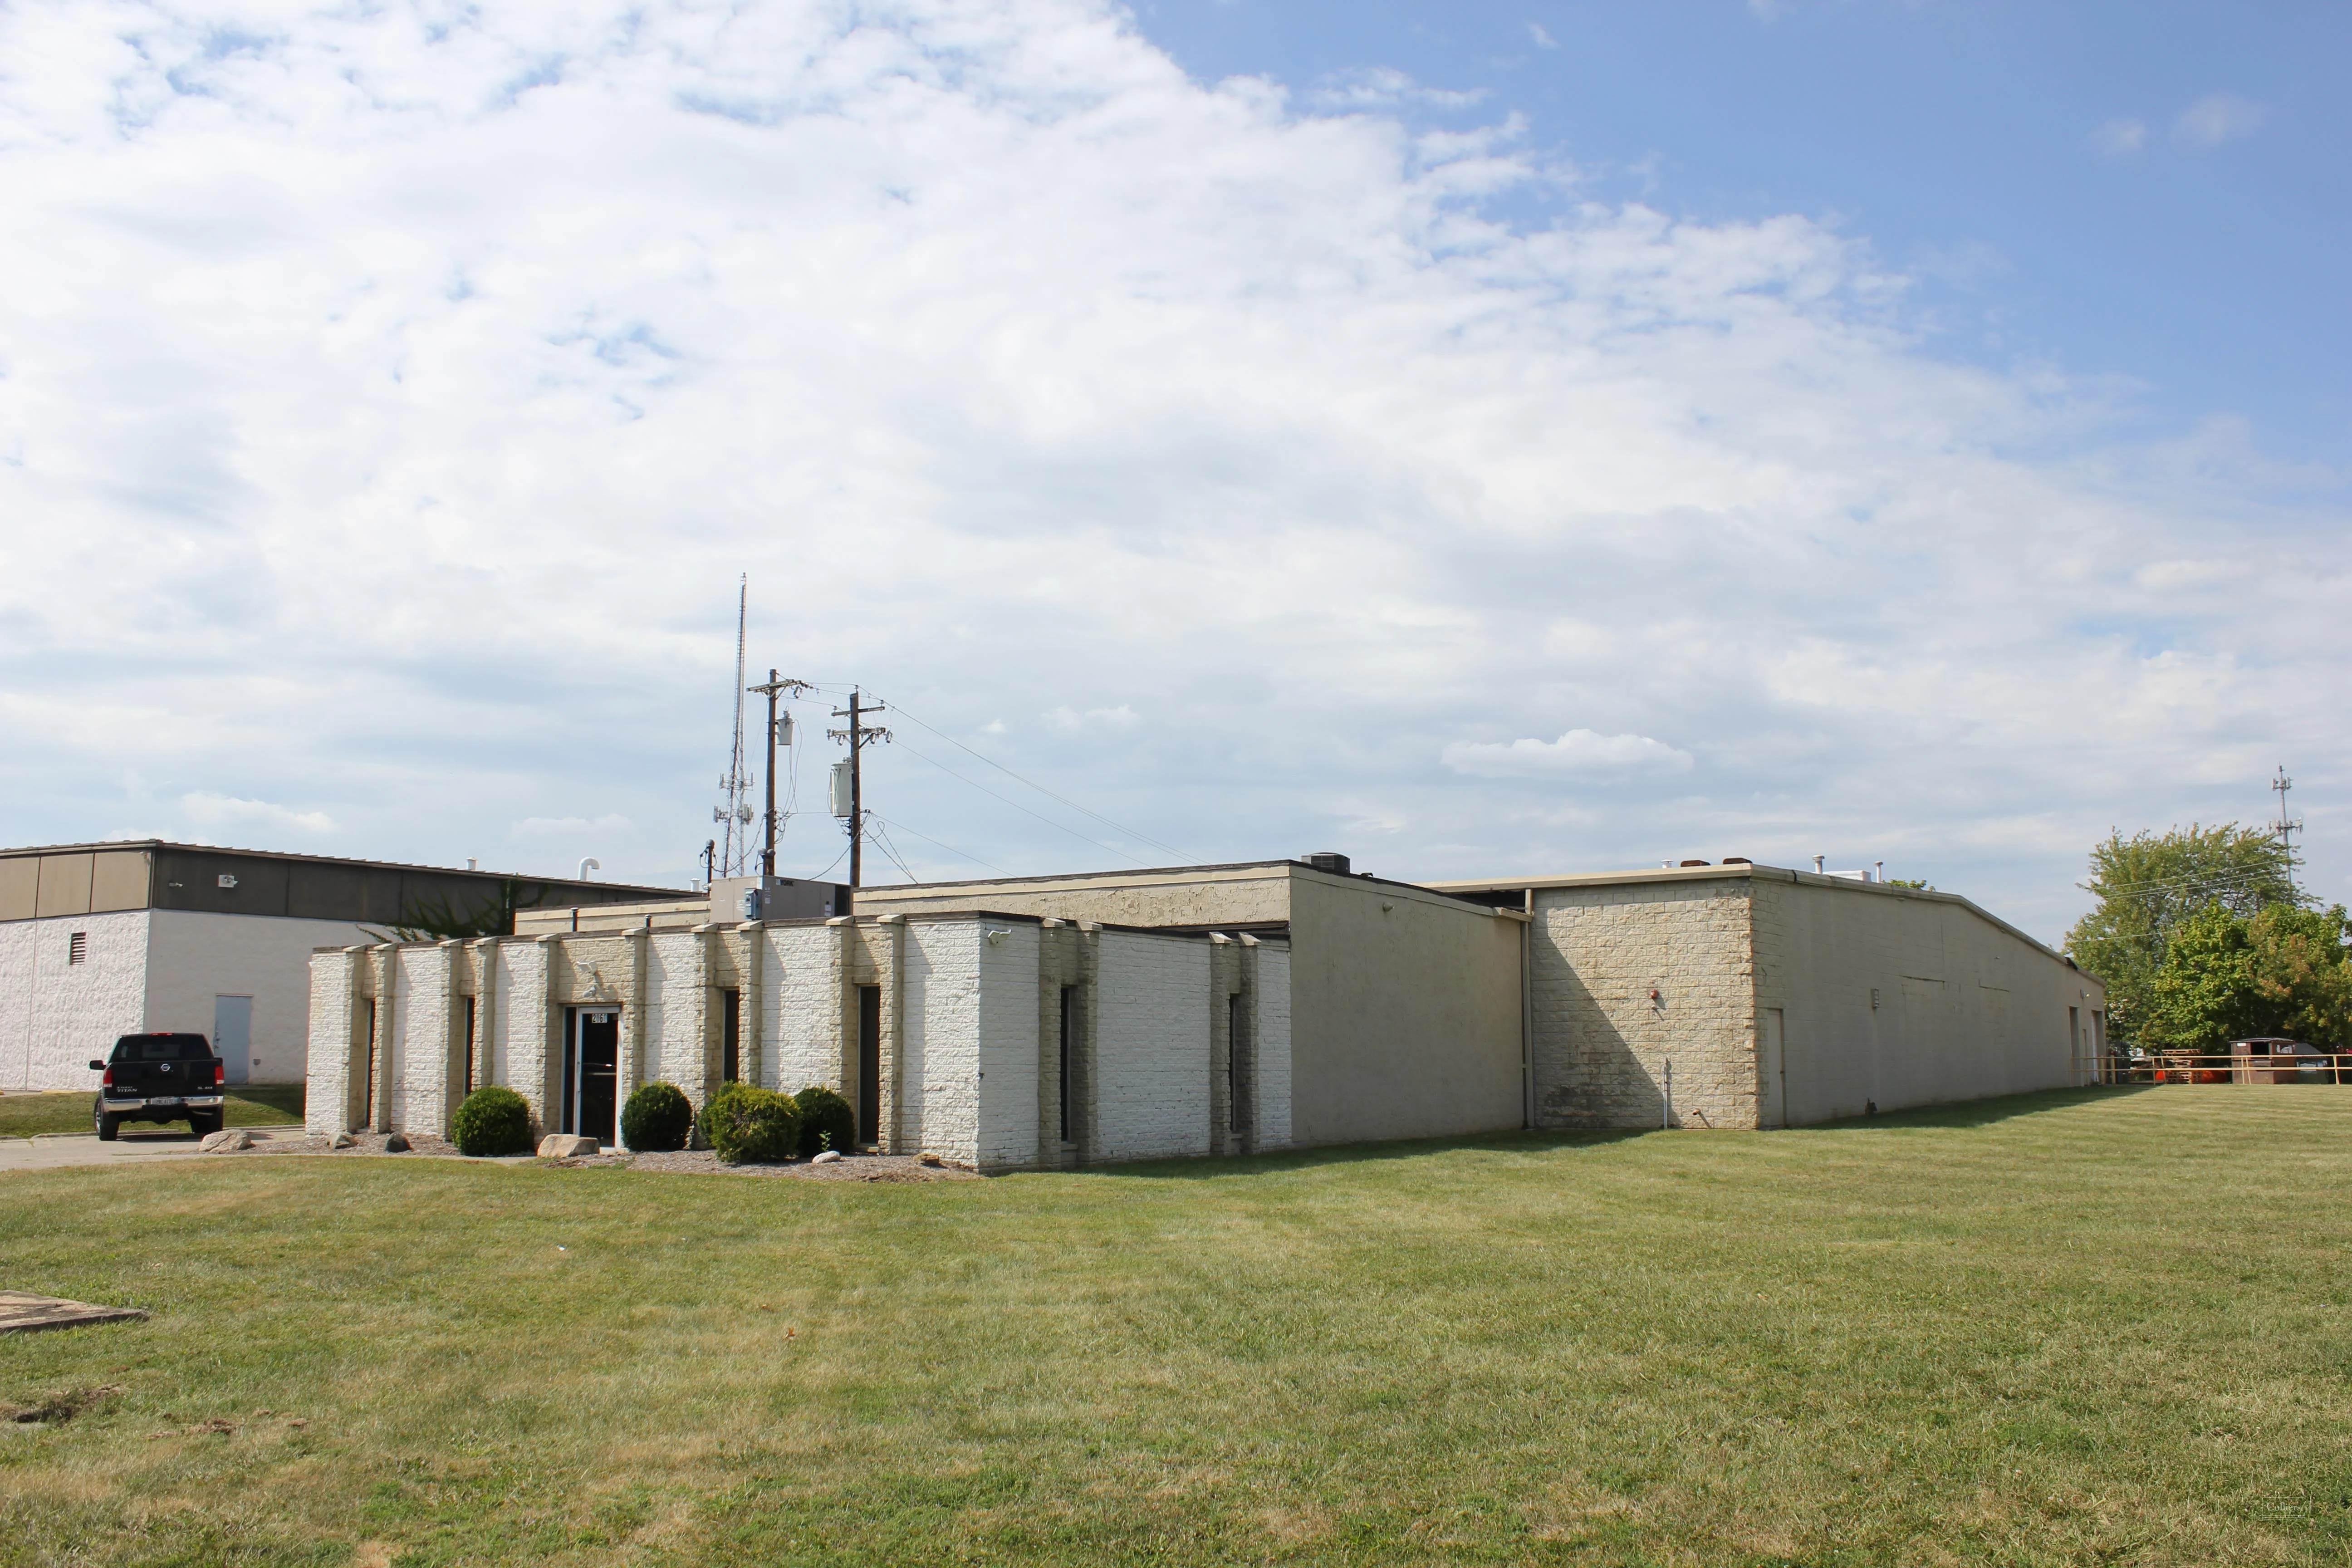
Now Available for Sale, Industrial, located at 7516 Camargo Rd.
Property description as provided by the listing source. PropZone adds independent market context, valuation estimates, and comparable listings.


Property Details
Market Context
This industrial in Cincinnati, OH is listed for sale across 26,565 SF. It has been on the market for 118 days.
As of Q1 2026, the Cincinnati industrial market showed a 5.8% vacancy rate, and cap rates around 8.6%. Source: multiple brokerages Q1 2026 market report.
Projected current pricing
low confidenceModeled estimate (income approach) shown as a range — not an appraisal. Projected asking rent × occupancy × net-operating-income margin band ÷ market cap rate, from Q1 2026 www lee-associates com data (cap rate 8.6%, asking rent held flat).
Tight vacancy keeps competition for quality space elevated.
Compare it against other industrial listings for sale in Cincinnati, OH to benchmark pricing and space — view the full market.
Industrial market FAQ
- What is the typical cap rate for industrial in Cincinnati?
- About 8.6% as of Q1 2026, per multiple brokerages.
- Is the Cincinnati industrial market tightening or softening?
- Vacancy is around 5.8% (Q1 2026).
Unified Estimate
Medium ConfidenceCost-of-business estimate only; rate estimator unavailable.
Sale Price History
Market report quarterly trend fallback
- Avg Rent ($/SF/yr) (market data)
- Vacancy %
Investment Analysis
Beta Feature: Investment Analysis is currently in beta testing. Metrics are calculated based on available financial data and market comparables. Results are for informational purposes and should not be considered financial advice. Verify all assumptions and consult with a financial advisor before making investment decisions.
Financing Assumptions
Insufficient financial data for full analysis. Add more financial fields to improve metric coverage.
Market Employment Trend
December 2025 • Source: BLS QCEW
Economic Indicators
Source: FRED
Market Demographics
Census ACS 20242024 American Community Survey 5-Year Estimates •Released annually by U.S. Census Bureau
Assumptions
- Interest rate: 6.47% (FRED live)
- Loan term: 25 years
- Down payment: 25.0%
- Market comparison: industrial in cincinnati, OH
More Industrial for Sale in Cincinnati, OH(5)

3665 Central Parkway
Cincinnati, OH
$600,000
Cap Rate
N/A
Price/SF
80.7/sf
SF
7.4K
2060 Waycross Road
Cincinnati, OH
Price on request
Cap Rate
N/A
Price/SF
N/A
SF
16.6K

6000 Fernview Ave
Cincinnati, OH
Price on request
Cap Rate
N/A
Price/SF
N/A
SF
83.1K

2889 E Crescentville Rd
Cincinnati, OH
Price on request
Cap Rate
N/A
Price/SF
N/A
SF
N/A

4612-4628 Paddock
cincinnati, OH
Price on request
Cap Rate
N/A
Price/SF
N/A
SF
62.7K
Documents
Contact Broker

Tom Fairhurst