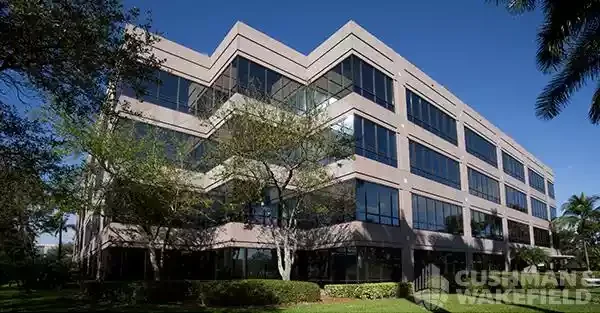
6303 Waterford at Blue Lagoon
Price
Price on request
Square Feet
166,064
Market rate estimate — not broker-provided
Cost-of-Business Details
High ConfidenceBased on 14 comparable office lease listings in the area.
| Component | Value | Detail | Source |
|---|---|---|---|
| Base Rent | $48.00/SF/mo | — | direct_comps |
| Utilities | — | 9.1¢/kWh | OpenEI URDB |
| Labor Index | — | $1453/wk | BLS QCEW |
Source Provenance (1)
| Source | Type | Count | Year | Freshness | Peer |
|---|---|---|---|---|---|
| OpenSearch Listings | comparable_listings | 14 | — | real-time | — |


Property Details
Lease Details
Market Context
This office in Miami, FL is listed for lease across 166,064 SF. The building dates to 1993. It has been on the market for 65 days.
As of Q4 2025, the Miami office market showed average asking rents near $61.49/SF/yr, and rents up 2.6% year over year. Source: multiple brokerages Q4 2025 market report.
Projected current pricing
low confidenceModeled estimate (income approach) shown as a range — not an appraisal. Projected asking rent × occupancy × net-operating-income margin band ÷ market cap rate, from Q4 2025 multiple brokerages data (cap rate 6.9%, asking rent trend-adjusted to today).
Rising rents point to a competitive market where well-priced, well-located space leases quickly.
Compare it against other office listings for lease in Miami, FL to benchmark pricing and space — view the full market.
Unified Estimate
High ConfidenceRate-first confidence-weighted blend with cost-of-business adjustment.
Lease Rate & Market Trend
2024 – 2025 · county sold comps + market trendsFIPS 12086
- Avg Rent ($/SF/mo) (market data)
- Median $/SF (sold)
- Vacancy %
Investment Analysis
Beta Feature: Investment Analysis is currently in beta testing. Metrics are calculated based on available financial data and market comparables. Results are for informational purposes and should not be considered financial advice. Verify all assumptions and consult with a financial advisor before making investment decisions.
Insufficient financial data for full analysis. Add more financial fields to improve metric coverage.
Market Employment Trend
December 2025 • Source: BLS QCEW
Economic Indicators
Source: FRED
Market Demographics
Census ACS 20242024 American Community Survey 5-Year Estimates •Released annually by U.S. Census Bureau
Sold Comps
Q3 2025Source: florida_dor · County FIPS: 12086
Assumptions
- Market comparison: office in miami, FL
More Office for Lease in Miami, FL(5)
6303 Waterford at Blue Lagoon
Miami, FL
Price on request
Cap Rate
N/A
Price/SF
N/A
SF
166.1K

701 Waterford
miami, FL
Price on request
Cap Rate
N/A
Price/SF
24.0/sf
SF
N/A

6100 Waterford
miami, FL
Price on request
Cap Rate
N/A
Price/SF
N/A
SF
163.0K

6505 Waterford
miami, FL
Price on request
Cap Rate
N/A
Price/SF
N/A
SF
166.4K

800 Waterford
miami, FL
Price on request
Cap Rate
N/A
Price/SF
N/A
SF
246.1K