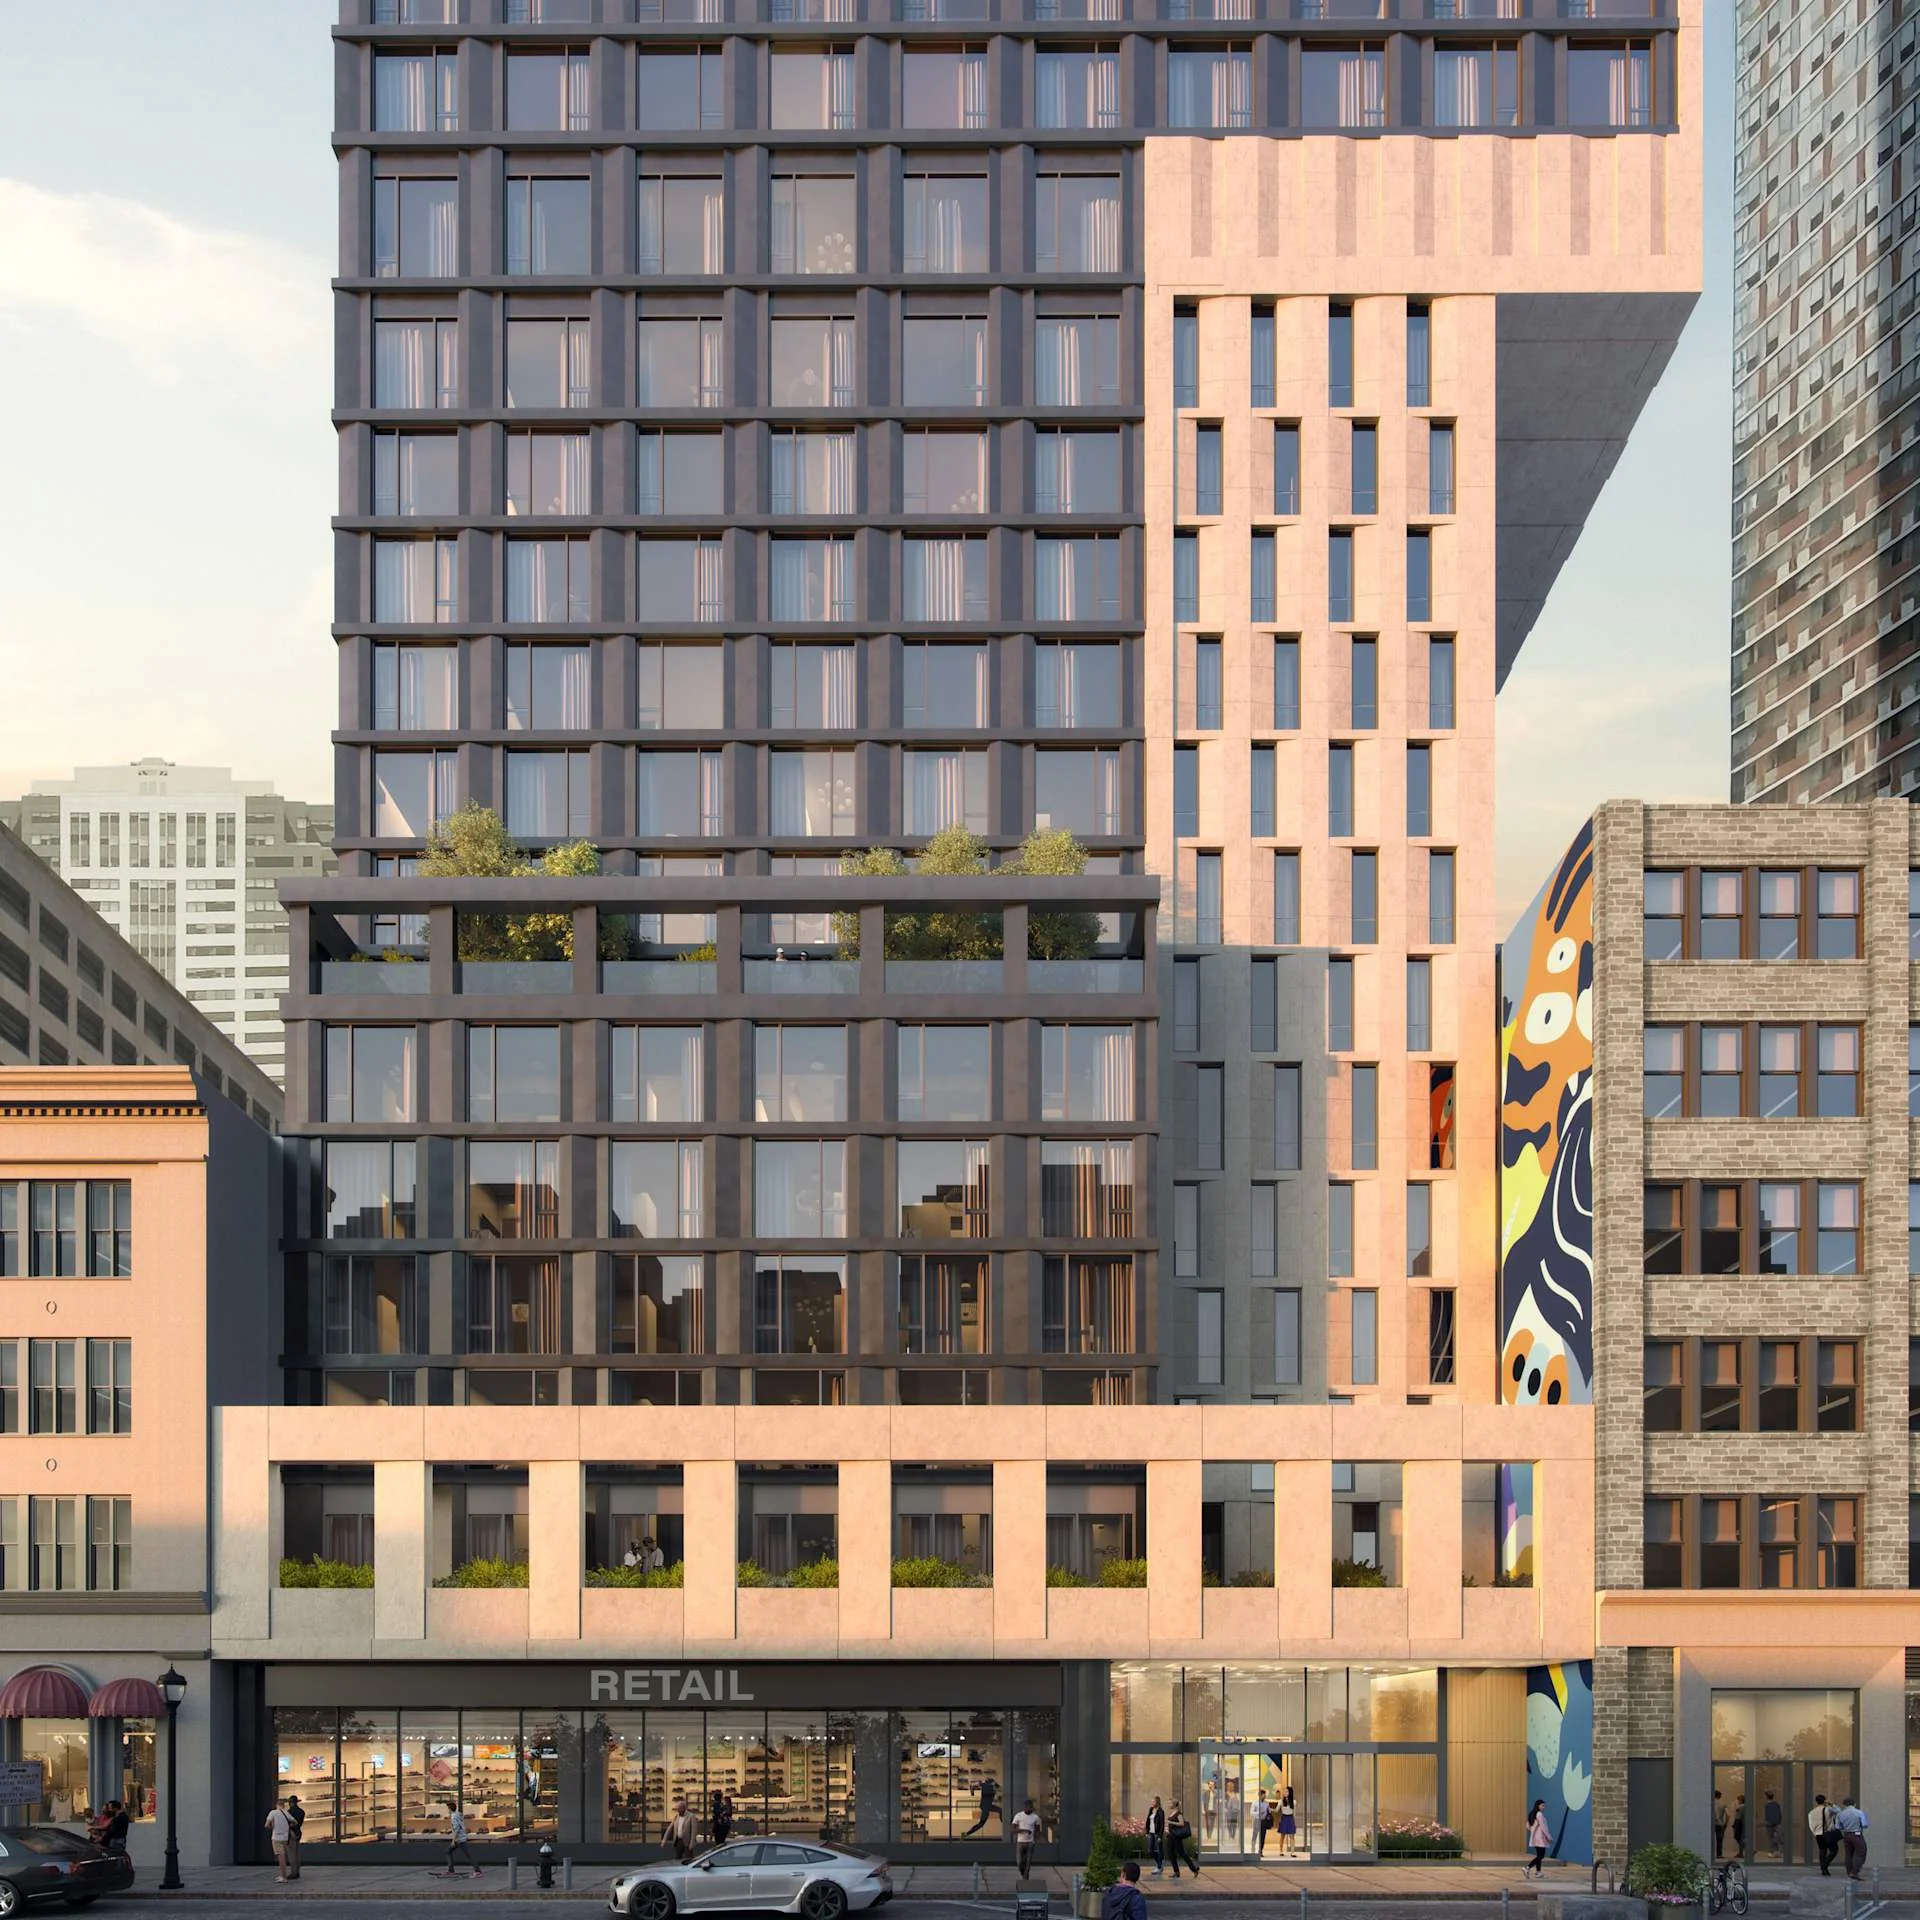
51 Willoughby Street
Price
Price on request
Market rate estimate — not broker-provided
Cost-of-Business Details
Medium ConfidenceEstimated from market cap rate (6.2%), property tax rate (0.05%), and wage-adjusted baseline.
| Component | Value | Detail | Source |
|---|---|---|---|
| Base Rent | $42.85/SF | — | tax_cap_reverse |
| Utilities | — | 2.4¢/kWh | OpenEI URDB |
| Property Tax | — | 0.1% eff. rate | API Ninjas |
| Labor Index | — | $2903/wk | BLS QCEW |
Source Provenance (3)
| Source | Type | Count | Year | Freshness | Peer |
|---|---|---|---|---|---|
| Market Reports | cap_rate | — | — | quarterly | — |
| API Ninjas | property_tax | — | — | annual | — |
| BLS QCEW | wage_index | — | — | quarterly | — |
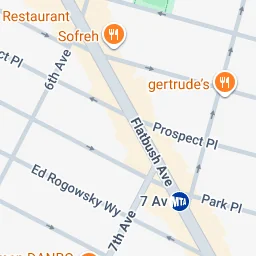
Location
51 willoughby st brooklyn, ny, 11201, brooklyn, NY 11201


Market Context
As of Q1 2026, the New York City Area retail market showed a 4.2% vacancy rate, average asking rents near $54.00/SF/yr, and cap rates around 6.2%. Source: www matthews com Q1 2026 market report.
Projected current pricing
low confidenceModeled estimate (income approach) shown as a range — not an appraisal. Projected asking rent × occupancy × net-operating-income margin band ÷ market cap rate, from Q1 2026 www matthews com data (cap rate 6.2%, asking rent held flat).
Tight vacancy keeps competition for quality space elevated.
Compare it against other retail listings for sale in Brooklyn, NY to benchmark pricing and space — view the full market.
Retail market FAQ
- What is the typical cap rate for retail in New York City Area?
- About 6.2% as of Q1 2026, per www matthews com.
- Is the New York City Area retail market tightening or softening?
- Vacancy is around 4.2% (Q1 2026).
Unified Estimate
Medium ConfidenceRate-first confidence-weighted blend with cost-of-business adjustment.
Sale Price History
2025 – 2026 · county sold comps + market trendsFIPS 36081
- Avg Rent ($/SF/yr) (market data)
- Median $/SF (sold)
- Vacancy %
Investment Analysis
Beta Feature: Investment Analysis is currently in beta testing. Metrics are calculated based on available financial data and market comparables. Results are for informational purposes and should not be considered financial advice. Verify all assumptions and consult with a financial advisor before making investment decisions.
Financing Assumptions
Insufficient financial data for full analysis. Add more financial fields to improve metric coverage.
Market Employment Trend
December 2025 • Source: BLS QCEW
Economic Indicators
Source: FRED
Market Demographics
Census ACS 20242024 American Community Survey 5-Year Estimates •Released annually by U.S. Census Bureau
Sold Comps
Q1 2026Sold median $684/SF is 1267.3% above asking avg $50/SF
Source: nyc_rolling_sales · County FIPS: 36061
Assumptions
- Interest rate: 6.47% (FRED live)
- Loan term: 25 years
- Down payment: 25.0%
- Market comparison: retail in brooklyn, NY
More Retail for Sale in Brooklyn, NY(5)
127 12th Street
brooklyn, NY
Price on request
Cap Rate
N/A
Price/SF
N/A
SF
N/A

235 Kent Avenue
brooklyn, NY
Price on request
Cap Rate
N/A
Price/SF
N/A
SF
N/A
395 Flatbush Avenue
brooklyn, NY
Price on request
Cap Rate
N/A
Price/SF
N/A
SF
9.5K
510 Sackett Street
brooklyn, NY
Price on request
Cap Rate
N/A
Price/SF
N/A
SF
19.4K
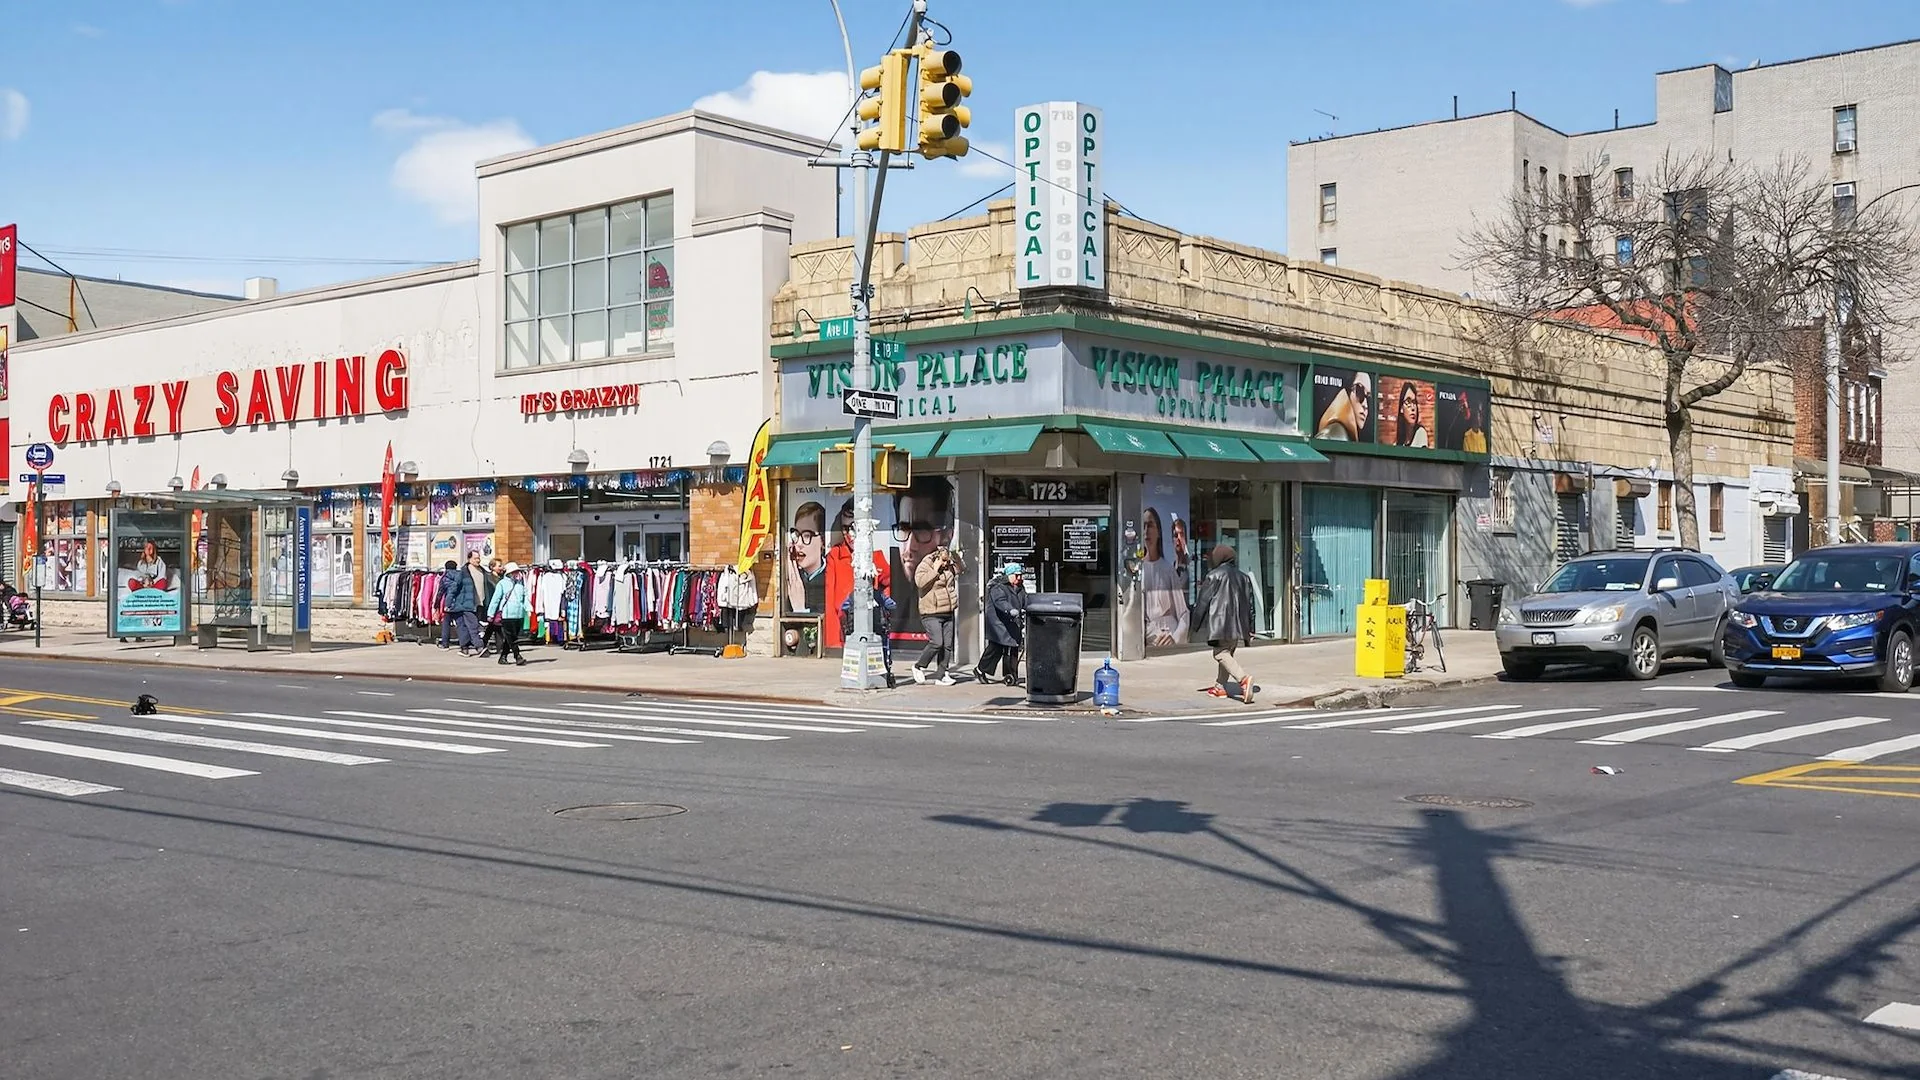
17071723 Avenue U
brooklyn, NY
Price on request
Cap Rate
7.4%
Price/SF
N/A
SF
N/A