5250 S 31st Place
Price
Price on request
Price/Sq Ft
$1.35
Description
- •±16,422 SF Freestanding Industrial Building on ±1.01 acres FOR LEASE
- •±16,422 SF freestanding building on ±1.01 acres
- •±2,656 SF main floor office/showroom
- •±12,960 SF warehouse
- •Corner lot with drive through access
- •±10,375 SF gated rear yard area, fenced and secured
- •18’ clear ceiling height
- •Evaporative cooling (new 2025)
- •Truckwell loading area
- •Three grade level loading doors (Two 12’ x 14’ and One 18’ x 14’)
- •8 covered parking stalls
- •Renovations - Summer 2025: New Roof, new exterior paint New asphalt parking lot, new breakroom cabinets & sink New interior flooring and paint in office/showroom
- •Asking $1.30/SF NNN
- •OpEx $0.25/SF
- •Available Immediately
Property description as provided by the listing source. PropZone adds independent market context, valuation estimates, and comparable listings.


Financial Details
Market Context
As of Q1 2026, the Phoenix industrial market showed a 11.9% vacancy rate, average asking rents near $13.08/SF/yr, and rents up 14.4% year over year. Source: multiple brokerages Q1 2026 market report.
Projected current pricing
low confidenceModeled estimate (income approach) shown as a range — not an appraisal. Projected asking rent × occupancy × net-operating-income margin band ÷ market cap rate, from Q1 2026 multiple brokerages data (cap rate 5.8%, asking rent trend-adjusted to today).
Rising rents point to a competitive market where well-priced, well-located space leases quickly.
Compare it against other industrial listings for lease in Phoenix, AZ to benchmark pricing and space — view the full market.
Industrial market FAQ
- Is the Phoenix industrial market tightening or softening?
- Vacancy is around 11.9%, with asking rents rising year over year (Q1 2026).
Unified Estimate
Medium ConfidenceRate-first confidence-weighted blend with cost-of-business adjustment.
Lease Rate & Market Trend
Market report quarterly trend fallbackFIPS 04013
- Avg Rent ($/SF/mo) (market data)
- Vacancy %
Investment Analysis
Beta Feature: Investment Analysis is currently in beta testing. Metrics are calculated based on available financial data and market comparables. Results are for informational purposes and should not be considered financial advice. Verify all assumptions and consult with a financial advisor before making investment decisions.
Market Employment Trend
December 2025 • Source: BLS QCEW
Economic Indicators
Source: FRED
Market Demographics
Census ACS 20242024 American Community Survey 5-Year Estimates •Released annually by U.S. Census Bureau
Rent vs. Market
$1.3
62.3% below market average
Listed at $1.3/sqft/mo vs. market avg $3.45/sqft/mo
Assumptions
- Market comparison: industrial in phoenix, AZ
More Industrial for Lease in Phoenix, AZ(5)

2246 S Central Ave
phoenix, AZ
Price on request
Cap Rate
N/A
Price/SF
1.0/sf
SF
N/A

Industrial Building
phoenix, AZ
Price on request
Cap Rate
N/A
Price/SF
1.8/sf
SF
N/A

921 S Park Lane
tempe, AZ
Price on request
Cap Rate
N/A
Price/SF
1.1/sf
SF
N/A
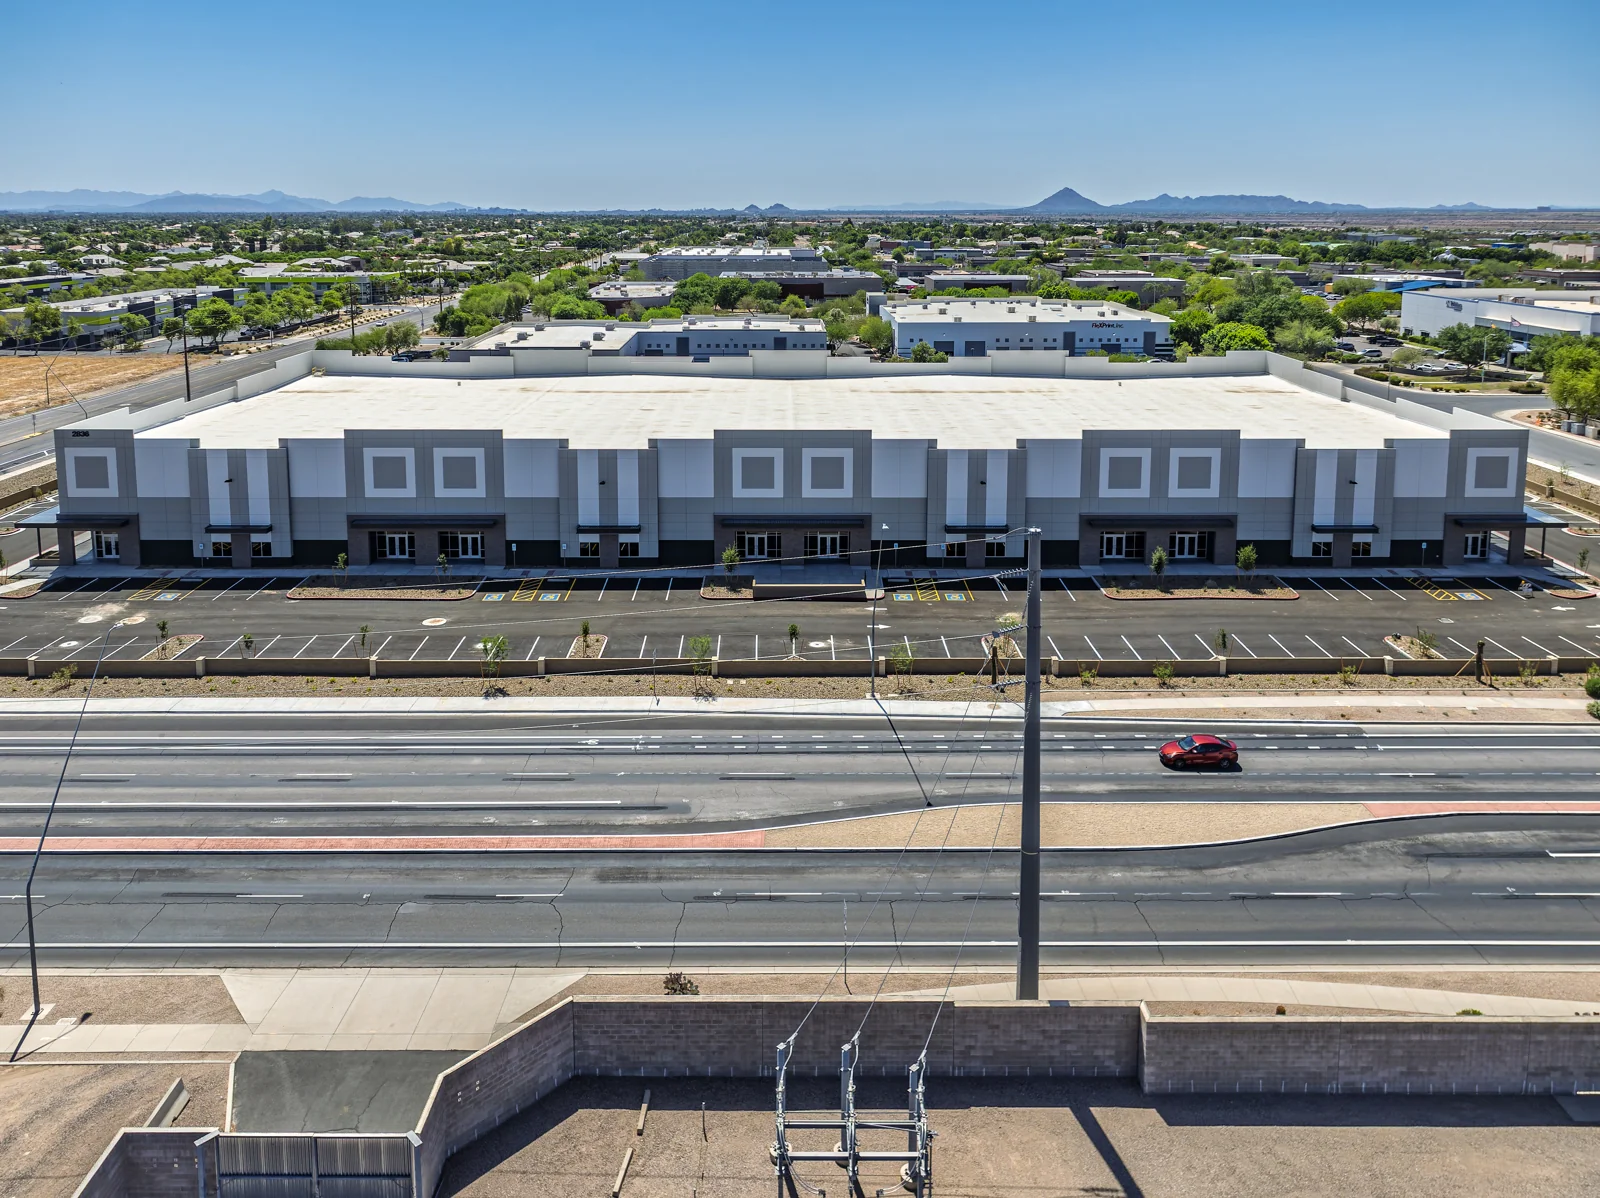
2836 N Greenfield Rd
mesa, AZ
Price on request
Cap Rate
N/A
Price/SF
1.4/sf
SF
N/A
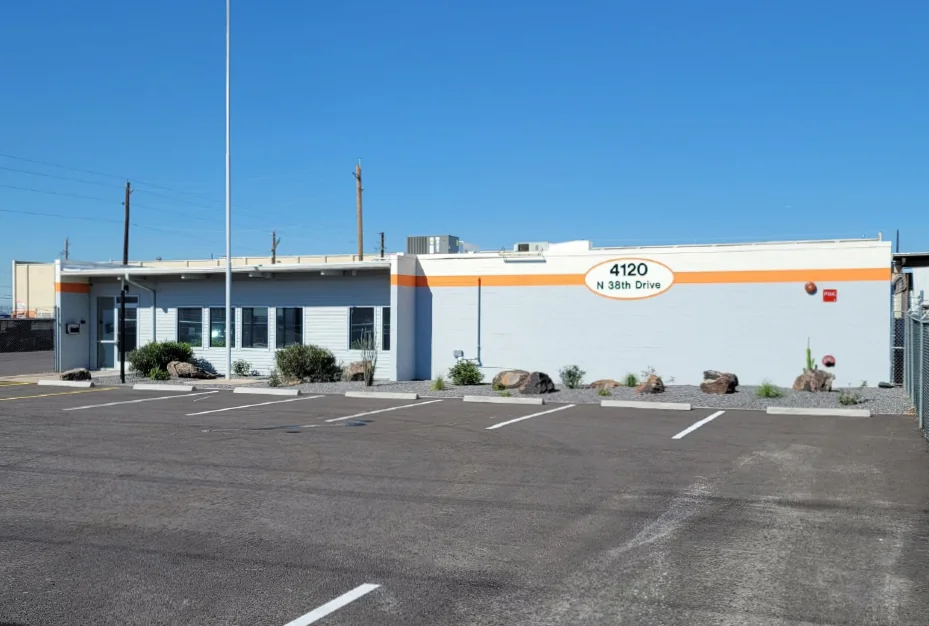
4120 N 38th Drive
phoenix, AZ
Price on request
Cap Rate
N/A
Price/SF
N/A
SF
N/A