4990 Eisenhauer Rd
Price
Price on request
Market rate estimate — not broker-provided
Cost-of-Business Details
Medium ConfidenceEstimated from market cap rate (7.6%), property tax rate (0.02%), and wage-adjusted baseline.
| Component | Value | Detail | Source |
|---|---|---|---|
| Base Rent | $0.87/SF/mo | — | tax_cap_reverse |
| Utilities | — | 3.7¢/kWh | OpenEI URDB |
| Property Tax | — | 0.0% eff. rate | API Ninjas |
| Labor Index | — | $1242/wk | BLS QCEW |
Source Provenance (3)
| Source | Type | Count | Year | Freshness | Peer |
|---|---|---|---|---|---|
| Market Reports | cap_rate | — | — | quarterly | — |
| API Ninjas | property_tax | — | — | annual | — |
| BLS QCEW | wage_index | — | — | quarterly | — |
Description
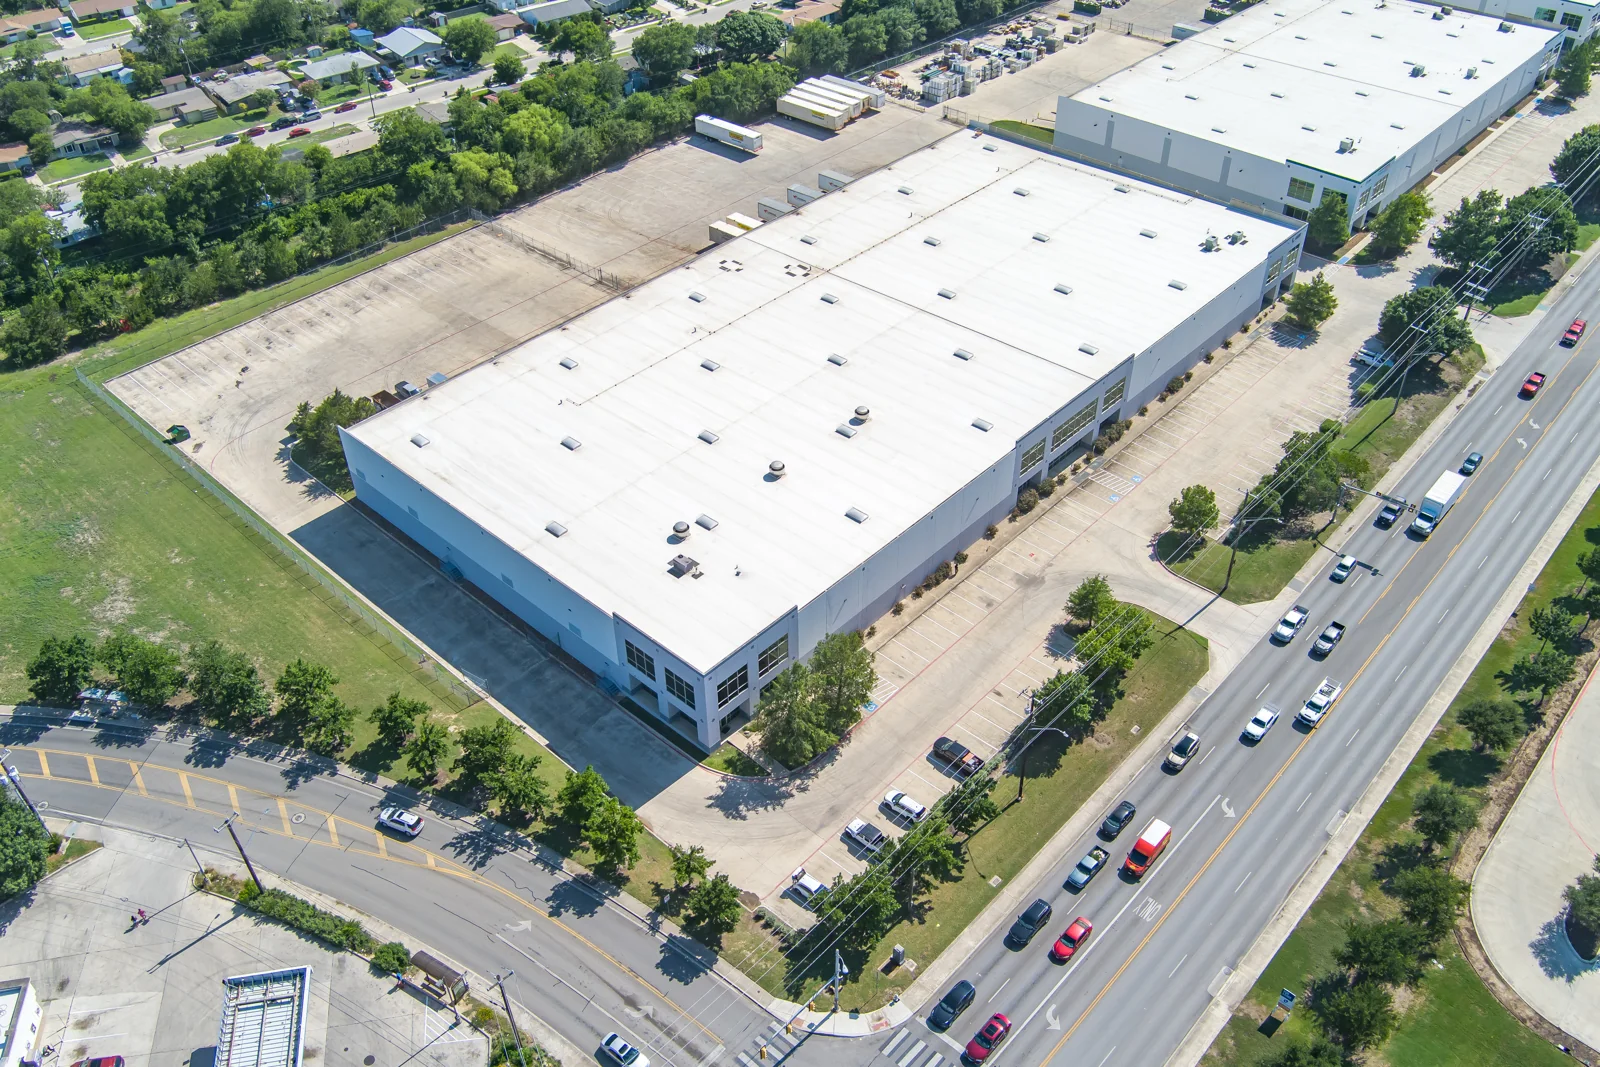
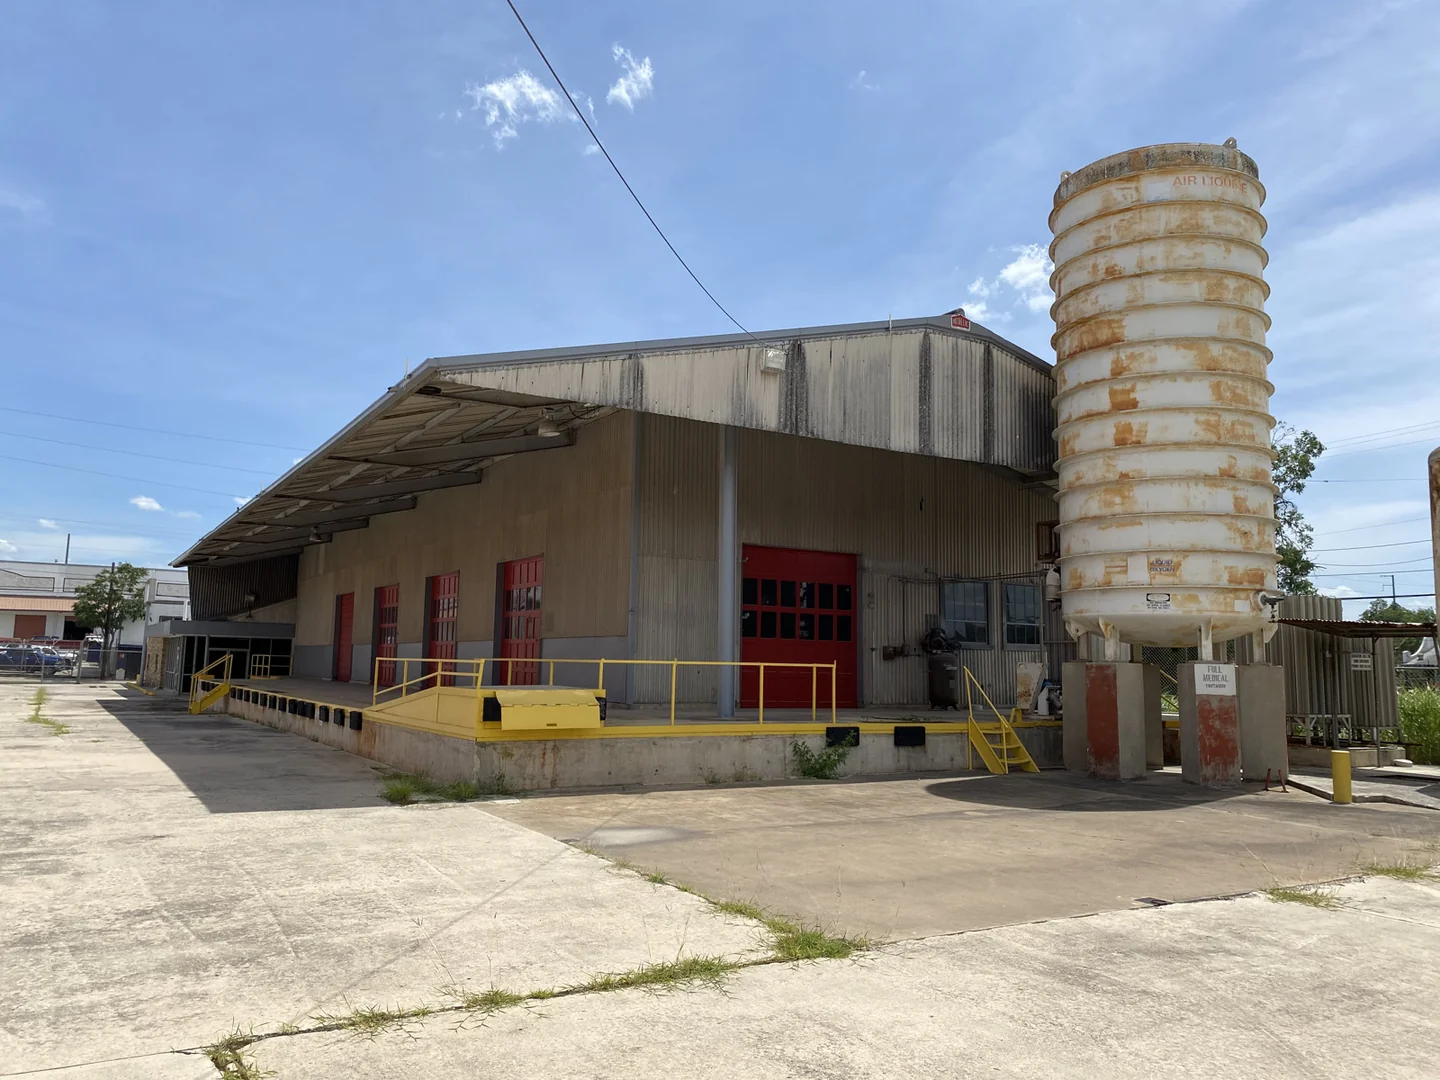
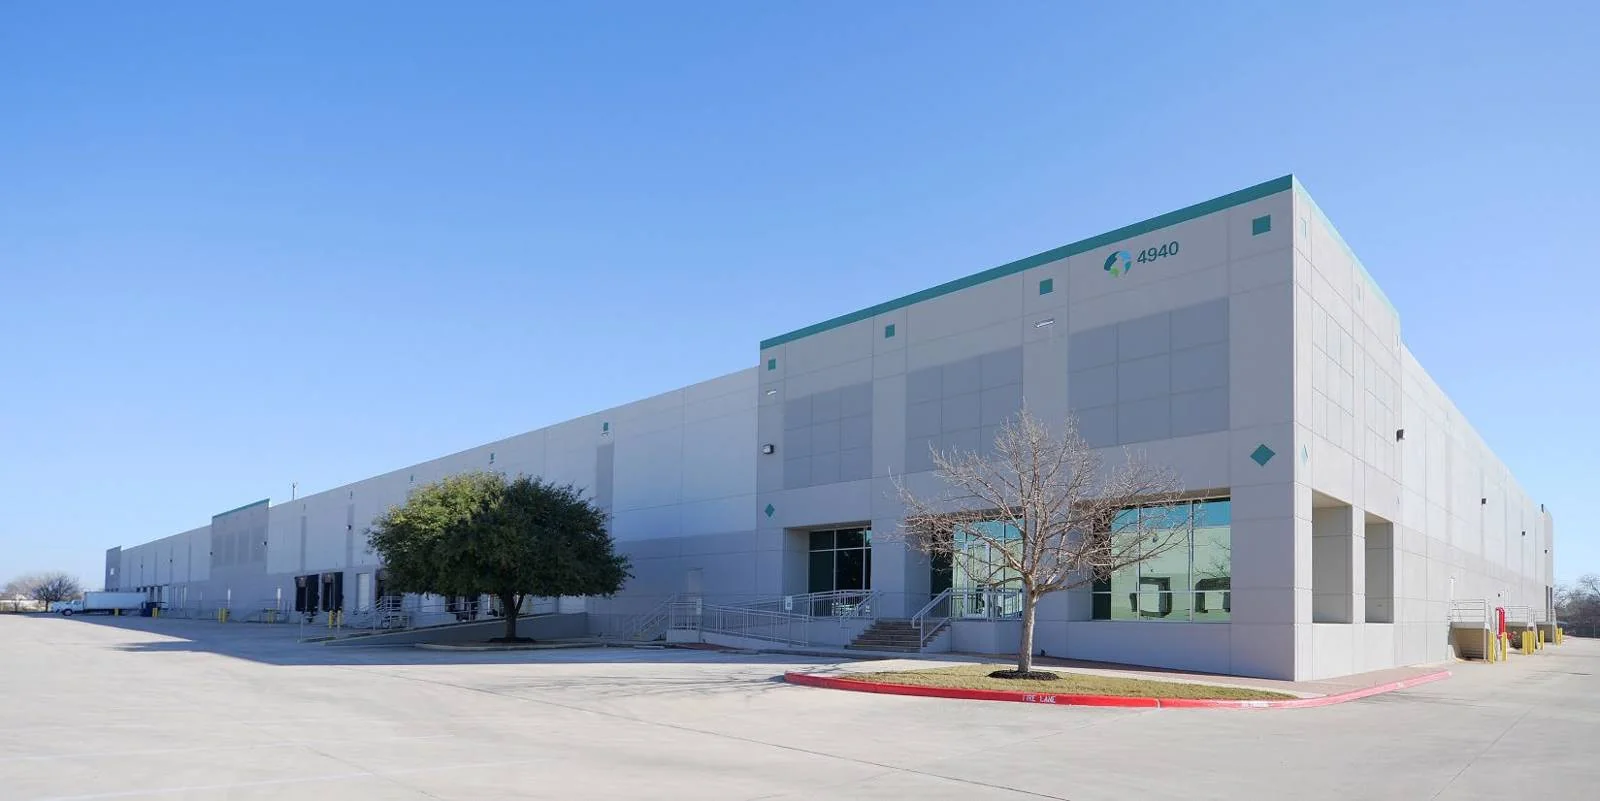
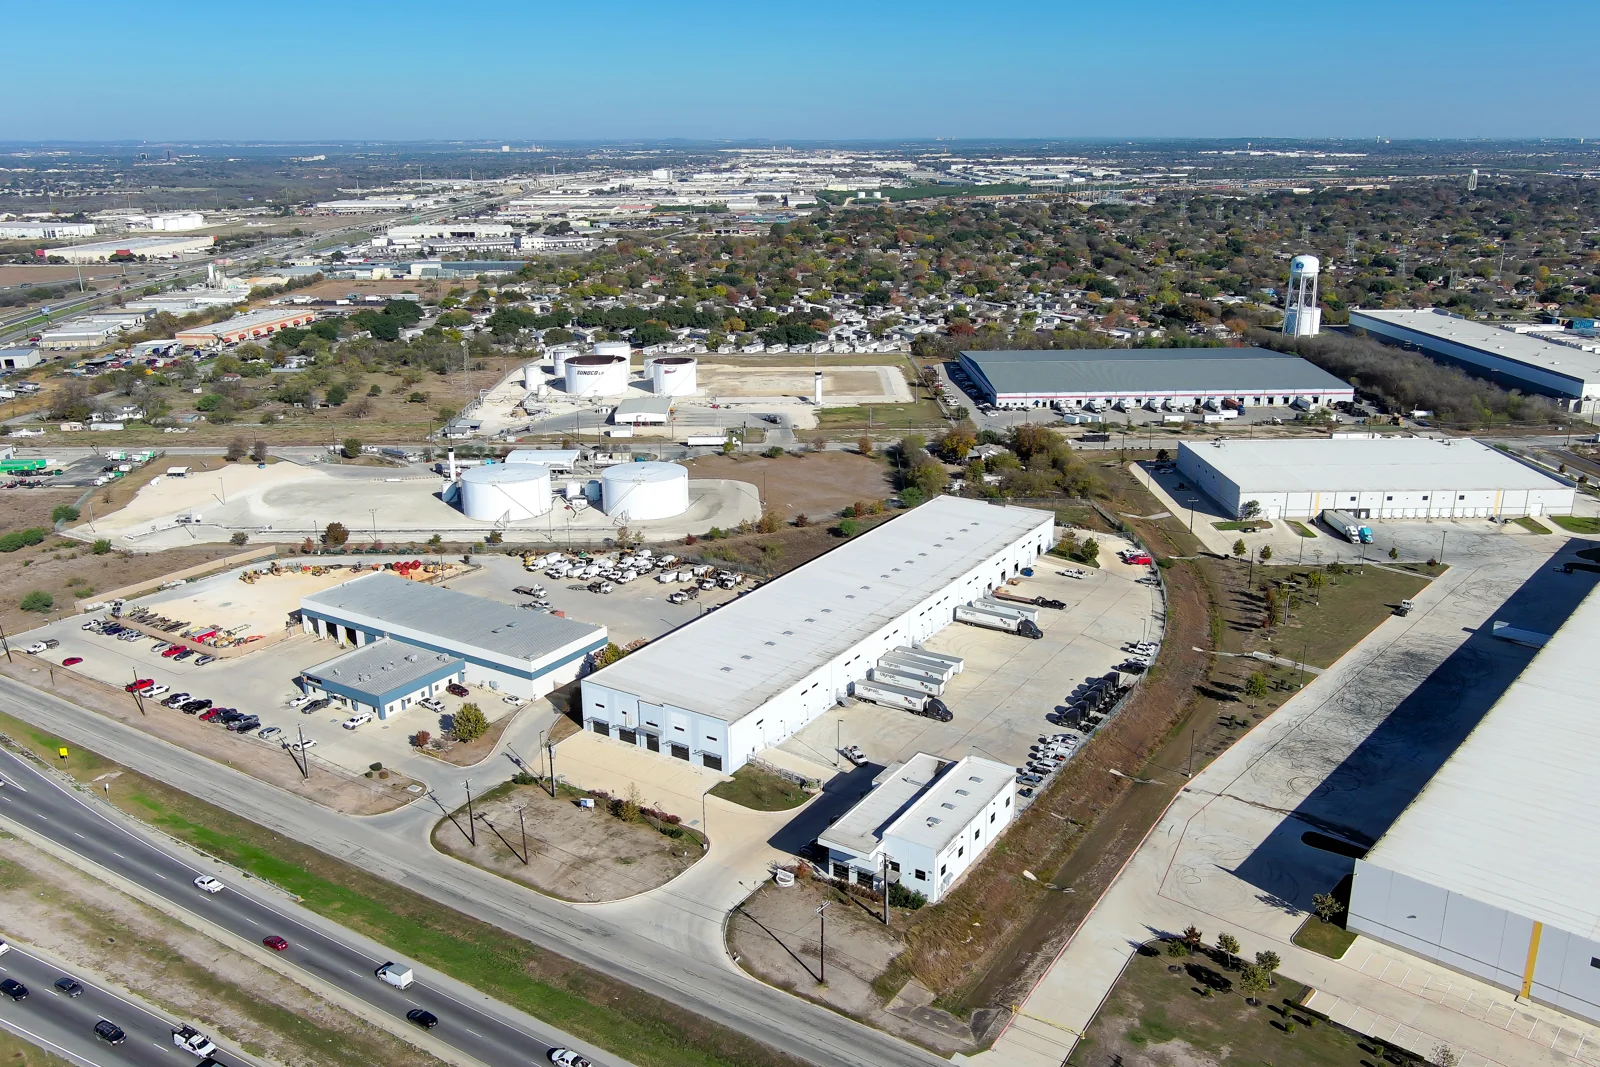
±44,000 SF Rear Load Industrial Warehouse in NE San Antonio - 28-foot clear height with ESFR sprinklers -180' extended truck court, fully fenced - Ample car and trailer parking on-site - 10 dock-high doors and 1 ramped door - Rear-load configuration with modern specs -Easy access to Loop 410 and I-35 corridors
Property description as provided by the listing source. PropZone adds independent market context, valuation estimates, and comparable listings.


Financial Details
Market Context
As of Q1 2026, the San Antonio industrial market showed a 11.5% vacancy rate, average asking rents near $8.56/SF/yr, rents up 25.3% year over year, and cap rates around 7.6%. Source: multiple brokerages Q1 2026 market report.
Projected current pricing
high confidenceModeled estimate (income approach) shown as a range — not an appraisal. Projected asking rent × occupancy × net-operating-income margin band ÷ market cap rate, from Q1 2026 multiple brokerages data (cap rate 7.6%, asking rent held flat).
Rising rents point to a competitive market where well-priced, well-located space leases quickly.
Compare it against other industrial listings for lease in San Antonio, TX to benchmark pricing and space — view the full market.
Industrial market FAQ
- What is the typical cap rate for industrial in San Antonio?
- About 7.6% as of Q1 2026, per multiple brokerages.
- Is the San Antonio industrial market tightening or softening?
- Vacancy is around 11.5%, with asking rents rising year over year (Q1 2026).
Unified Estimate
Medium ConfidenceRate-first confidence-weighted blend with cost-of-business adjustment.
Lease Rate & Market Trend
Market report quarterly trend fallback
- Avg Rent ($/SF/mo) (market data)
- Vacancy %
Investment Analysis
Beta Feature: Investment Analysis is currently in beta testing. Metrics are calculated based on available financial data and market comparables. Results are for informational purposes and should not be considered financial advice. Verify all assumptions and consult with a financial advisor before making investment decisions.
Insufficient financial data for full analysis. Add more financial fields to improve metric coverage.
Market Employment Trend
December 2025 • Source: BLS QCEW
Economic Indicators
Source: FRED
Market Demographics
Census ACS 20242024 American Community Survey 5-Year Estimates •Released annually by U.S. Census Bureau
Assumptions
- Market comparison: industrial in san antonio, TX
More Industrial for Lease in San Antonio, TX(5)
Property in Unknown, XX
San Antonio, TX
Price on request
Cap Rate
N/A
Price/SF
N/A
SF
N/A

Eisenhauer Business Park - Suite 270
san antonio, TX
Price on request
Cap Rate
N/A
Price/SF
N/A
SF
N/A
Prologis Eisenhauer Road 2
san antonio, TX
Price on request
Cap Rate
N/A
Price/SF
N/A
SF
2.4K
8106 NE Loop 410
san antonio, TX
Price on request
Cap Rate
N/A
Price/SF
N/A
SF
N/A
2442 Brockton Street
san antonio, TX
Price on request
Cap Rate
N/A
Price/SF
13.5/sf
SF
N/A
Documents
Contact Broker

Rob Burlingame

Josh Aguilar

Brad O'Neill
Listed by
CBRE System Import