
3716 Eagle Rock Blvd - Partake Collective
Price
Price on request
Market rate estimate — not broker-provided
Cost-of-Business Details
Medium ConfidenceEstimated from market cap rate (7.2%), property tax rate (0.01%), and wage-adjusted baseline.
| Component | Value | Detail | Source |
|---|---|---|---|
| Base Rent | $2.17/SF/mo | — | tax_cap_reverse |
| Utilities | — | 2.6¢/kWh | OpenEI URDB |
| Property Tax | — | 0.0% eff. rate | API Ninjas |
| Labor Index | — | $1516/wk | BLS QCEW |
Source Provenance (3)
| Source | Type | Count | Year | Freshness | Peer |
|---|---|---|---|---|---|
| Market Reports | cap_rate | — | — | quarterly | — |
| API Ninjas | property_tax | — | — | annual | — |
| BLS QCEW | wage_index | — | — | quarterly | — |
Description
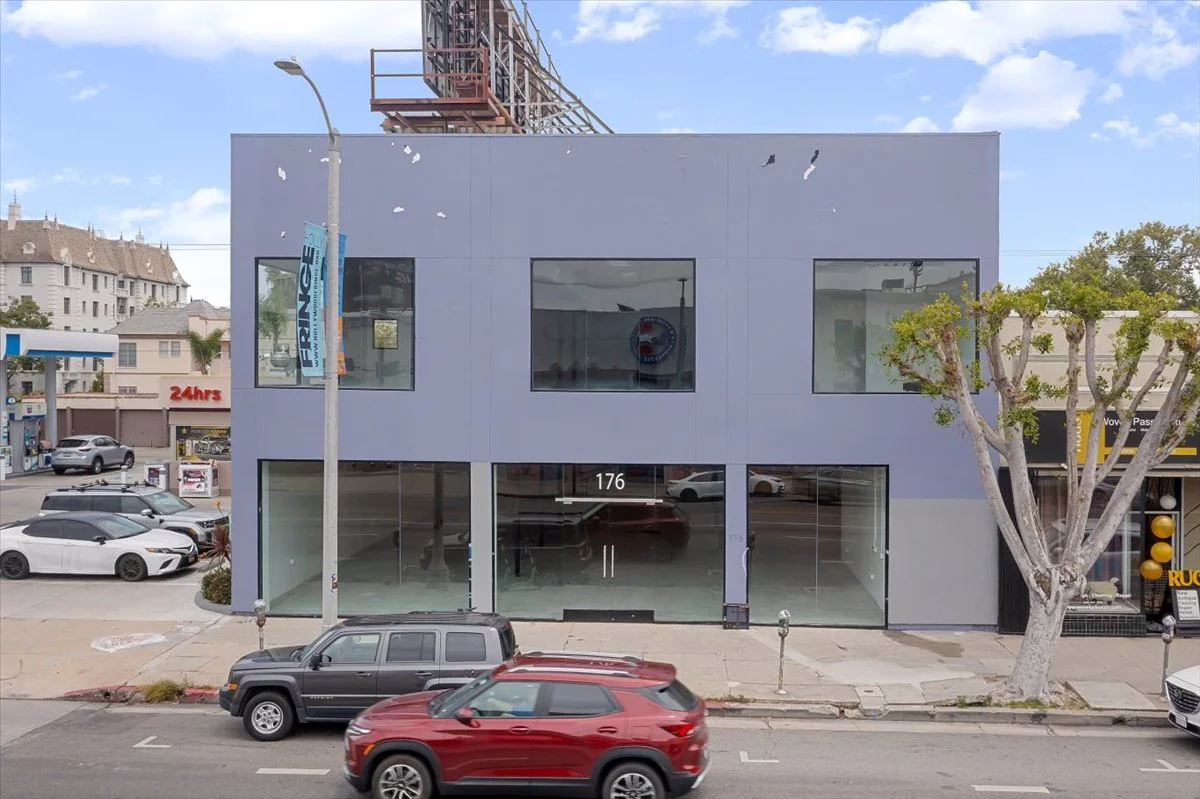
Newly-renovated restaurant and ghost kitchen complex - 2 Turn-key Restaurant Spaces - Ghost kitchen complex - Fully amenitized, Ghost kitchens for long term rentals - Type 47 CUP (Full line of alcoholic beverages) - Outdoor garden bar connected to dining room - On-site parking lot
Property description as provided by the listing source. PropZone adds independent market context, valuation estimates, and comparable listings.
Location
3716 eagle rock blvd - partake collective, los angeles, CA 90065


Financial Details
Market Context
As of Q3 2023, the Greater Los Angeles retail market showed rents up 0.5% year over year, and cap rates around 5.0%. Source: multiple brokerages Q3 2023 market report.
Projected current pricing
low confidenceModeled estimate (income approach) shown as a range — not an appraisal. Projected asking rent × occupancy × net-operating-income margin band ÷ market cap rate, from Q4 2025 Matthews data (cap rate 7.2%, asking rent trend-adjusted to today).
Compare it against other retail listings for lease in Los Angeles, CA to benchmark pricing and space — view the full market.
Retail market FAQ
- What is the typical cap rate for retail in Greater Los Angeles?
- About 5.0% as of Q3 2023, per multiple brokerages.
Unified Estimate
Medium ConfidenceRate-first confidence-weighted blend with cost-of-business adjustment.
Lease Rate & Market Trend
2000 – 2025 · county sold comps + market trendsFIPS 06037
- Median $/SF (sold)
Investment Analysis
Beta Feature: Investment Analysis is currently in beta testing. Metrics are calculated based on available financial data and market comparables. Results are for informational purposes and should not be considered financial advice. Verify all assumptions and consult with a financial advisor before making investment decisions.
Insufficient financial data for full analysis. Add more financial fields to improve metric coverage.
Market Employment Trend
December 2025 • Source: BLS QCEW
Economic Indicators
Source: FRED
Market Demographics
Census ACS 20242024 American Community Survey 5-Year Estimates •Released annually by U.S. Census Bureau
Sold Comps
Q1 2026Source: los_angeles_assessor · County FIPS: 06037
Assumptions
- Market comparison: retail in los angeles, CA
More Retail for Lease in Los Angeles, CA(4)
Property in Unknown, XX
Los Angeles, CA
$5.00M
Cap Rate
N/A
Price/SF
5.0/sf
SF
N/A
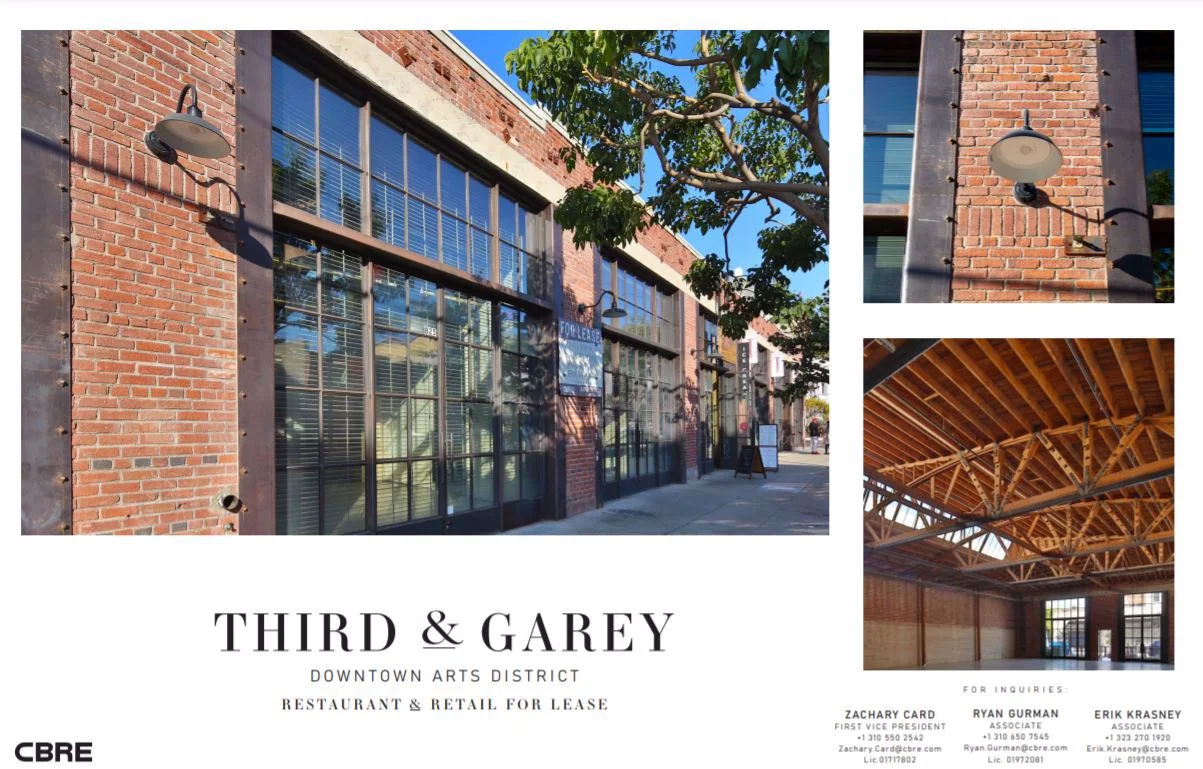
821-835 E 3rd St.
los angeles, CA
Price on request
Cap Rate
N/A
Price/SF
5.5/sf
SF
N/A

City National Plaza
los angeles, CA
Price on request
Cap Rate
N/A
Price/SF
3.0/sf
SF
N/A

10921 Wilshire Blvd.
los angeles, CA
Price on request
Cap Rate
N/A
Price/SF
N/A
SF
9.1K
Documents
Contact Broker

Derrick Moore
Shiho Takei Moore
Diandra Dillon
Listed by
CBRE System Import