3300 Central Pkwy
Price
Price on request
Market rate estimate — not broker-provided
Cost-of-Business Details
Medium ConfidenceEstimated from market cap rate (8.2%), property tax rate (0.02%), and wage-adjusted baseline.
| Component | Value | Detail | Source |
|---|---|---|---|
| Base Rent | $28.82/SF | — | tax_cap_reverse |
| Utilities | — | 14.7¢/kWh | OpenEI URDB |
| Property Tax | — | 0.0% eff. rate | API Ninjas |
| Labor Index | — | $1467/wk | BLS QCEW |
Source Provenance (3)
| Source | Type | Count | Year | Freshness | Peer |
|---|---|---|---|---|---|
| Market Reports | cap_rate | — | — | quarterly | — |
| API Ninjas | property_tax | — | — | annual | — |
| BLS QCEW | wage_index | — | — | quarterly | — |
Description
This 1.83 acre site in Cincinnati’s Midtown/Clifton neighborhood represents a compelling redevelopment and land sale opportunity. The property is ideally positioned for a range of development scenarios including QSR/drive-through, retail, mixed-use, or institutional use. Three combined parcels totaling 1.83 acres offer flexibility for infill development or ground-up construction. Existing structure on site.
Property description as provided by the listing source. PropZone adds independent market context, valuation estimates, and comparable listings.


Market Context
As of Q1 2026, the Cincinnati retail market showed rents up 7.6% year over year, and cap rates around 8.3%. Source: multiple brokerages Q1 2026 market report.
Projected current pricing
low confidenceModeled estimate (income approach) shown as a range — not an appraisal. Projected asking rent × occupancy × net-operating-income margin band ÷ market cap rate, from Q1 2026 Cushman & Wakefield data (cap rate 8.3%, asking rent trend-adjusted to today).
Rising rents point to a competitive market where well-priced, well-located assets trade quickly.
Compare it against other retail listings for sale in Cincinnati, OH to benchmark pricing and space — view the full market.
Retail market FAQ
- What is the typical cap rate for retail in Cincinnati?
- About 8.3% as of Q1 2026, per multiple brokerages.
Unified Estimate
Medium ConfidenceCost-of-business estimate only; rate estimator unavailable.
Sale Price History
Market report quarterly trend fallback
Investment Analysis
Beta Feature: Investment Analysis is currently in beta testing. Metrics are calculated based on available financial data and market comparables. Results are for informational purposes and should not be considered financial advice. Verify all assumptions and consult with a financial advisor before making investment decisions.
Financing Assumptions
Insufficient financial data for full analysis. Add more financial fields to improve metric coverage.
Market Employment Trend
December 2025 • Source: BLS QCEW
Economic Indicators
Source: FRED
Market Demographics
Census ACS 20242024 American Community Survey 5-Year Estimates •Released annually by U.S. Census Bureau
Assumptions
- Interest rate: 6.47% (FRED live)
- Loan term: 25 years
- Down payment: 25.0%
- Market comparison: retail in cincinnati, OH
More Retail for Sale in Cincinnati, OH(5)
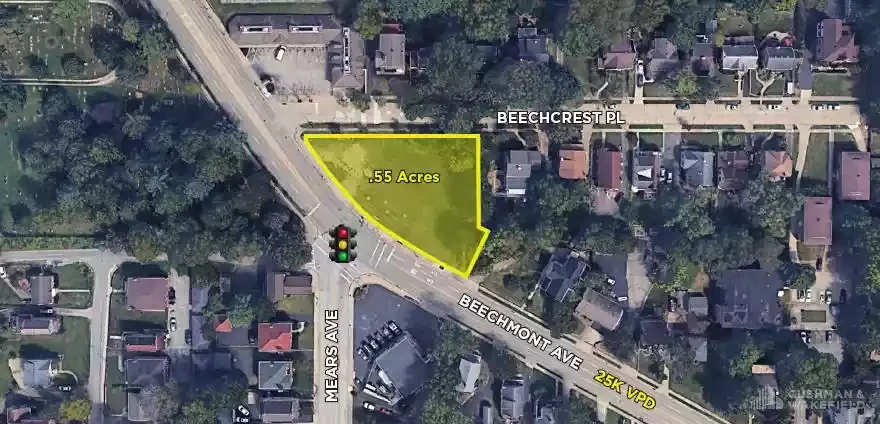
2010 Beechmont Avenue - Land
Cincinnati, OH
Price on request
Cap Rate
N/A
Price/SF
N/A
SF
24.0K
3300 Central Pkwy
Cincinnati, OH
Price on request
Cap Rate
N/A
Price/SF
N/A
SF
N/A
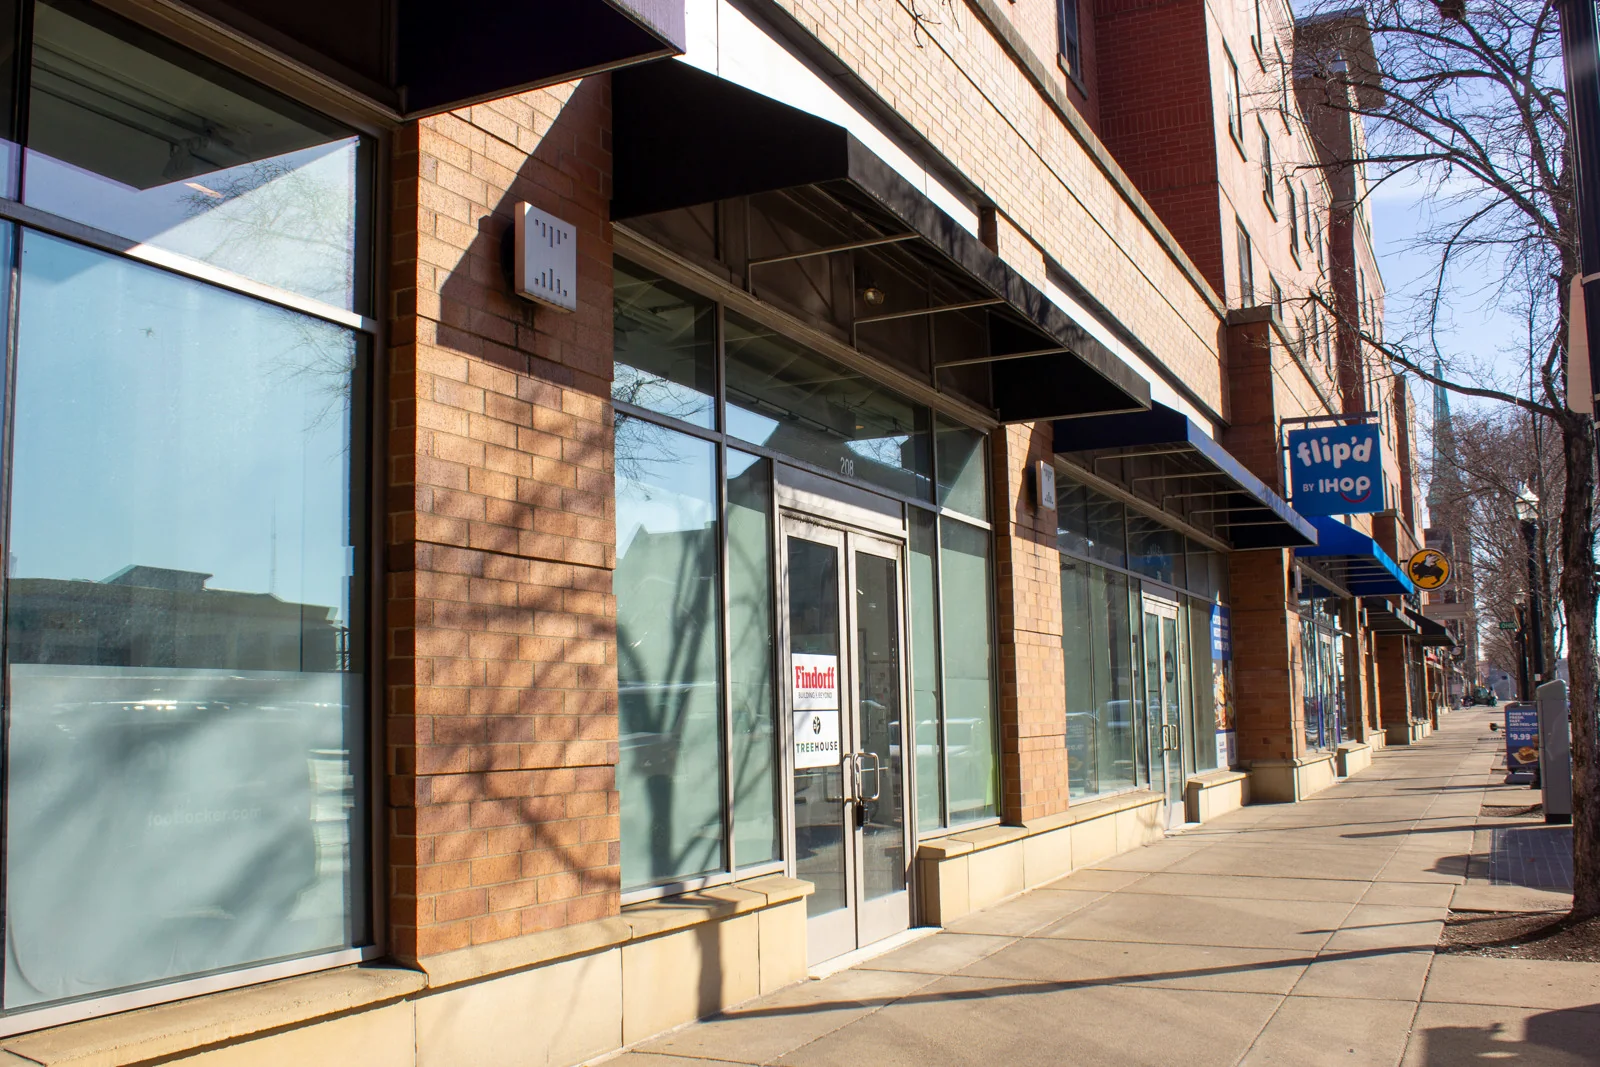
Calhoun Street Marketplace
cincinnati, OH
Price on request
Cap Rate
N/A
Price/SF
32.0/sf
SF
N/A
2010 Beechmont Avenue - Land
cincinnati, OH
Price on request
Cap Rate
N/A
Price/SF
N/A
SF
24.0K
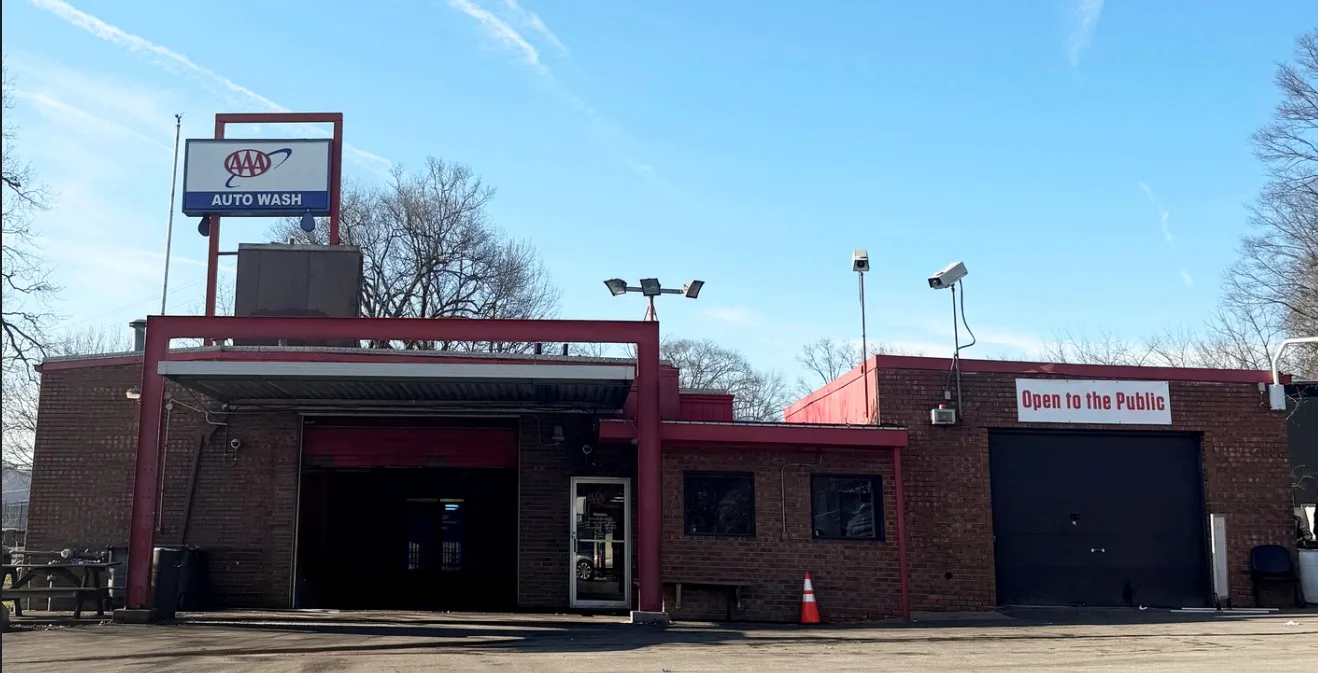
412 Central Ave
cincinnati, OH
Price on request
Cap Rate
N/A
Price/SF
N/A
SF
14.5K