299 Park Avenue
Price
Price on request
Square Feet
4,088
Market rate estimate — not broker-provided
Cost-of-Business Details
Medium ConfidenceEstimated from market cap rate (6.2%), property tax rate (0.05%), and NYC PLUTO (2,526 parcels, assessed $/SF = 180).
| Component | Value | Detail | Source |
|---|---|---|---|
| Base Rent | $2.96/SF/mo | — | tax_cap_reverse |
| Utilities | — | 2.4¢/kWh | OpenEI URDB |
| Property Tax | — | 0.1% eff. rate | API Ninjas |
| Labor Index | — | $2903/wk | BLS QCEW |
Source Provenance (3)
| Source | Type | Count | Year | Freshness | Peer |
|---|---|---|---|---|---|
| Market Reports | cap_rate | — | — | quarterly | — |
| API Ninjas | property_tax | — | — | annual | — |
| NYC PLUTO | assessed_value_psf | — | — | annual | — |


Property Details
Lease Details
Market Context
This retail in new york, NY is listed for lease across 4,088 SF. It has been on the market for 57 days.
As of Q1 2026, the New York City Area retail market showed a 4.2% vacancy rate, average asking rents near $54.00/SF/yr, and cap rates around 6.2%. Source: www.matthews.com Q1 2026 market report.
Projected current pricing
low confidenceModeled estimate (income approach) shown as a range — not an appraisal. Projected asking rent × occupancy × net-operating-income margin band ÷ market cap rate, from Q1 2026 www matthews com data (cap rate 6.2%, asking rent held flat).
Tight vacancy keeps competition for quality space elevated.
Compare it against other retail listings for lease in new york, NY to benchmark pricing and space — view the full market.
Retail market FAQ
- What is the typical cap rate for retail in New York City Area?
- About 6.2% as of Q1 2026, per www.matthews.com.
- Is the New York City Area retail market tightening or softening?
- Vacancy is around 4.2% (Q1 2026).
Unified Estimate
Medium ConfidenceRate-first confidence-weighted blend with cost-of-business adjustment.
Lease Rate & Market Trend
2025 – 2026 · county sold comps + market trendsFIPS 36061
- Avg Rent ($/SF/mo) (market data)
- Median $/SF (sold)
- Vacancy %
Investment Analysis
Beta Feature: Investment Analysis is currently in beta testing. Metrics are calculated based on available financial data and market comparables. Results are for informational purposes and should not be considered financial advice. Verify all assumptions and consult with a financial advisor before making investment decisions.
Insufficient financial data for full analysis. Add more financial fields to improve metric coverage.
Market Demographics
Census ACS 20242024 American Community Survey 5-Year Estimates •Released annually by U.S. Census Bureau
Sold Comps
Q1 2026Source: nyc_rolling_sales · County FIPS: 36061
Assumptions
- Market comparison: retail in new york, NY
More Retail for Lease in new york, NY(5)
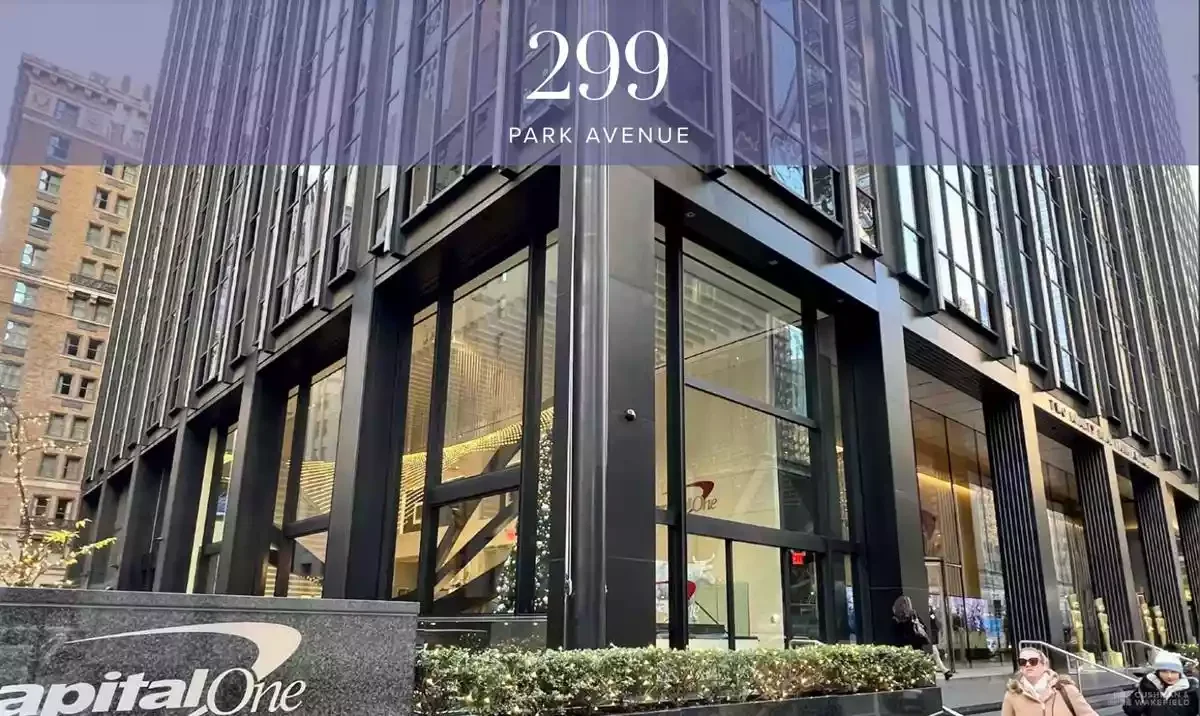
299 Park Avenue
New York, NY
Price on request
Cap Rate
N/A
Price/SF
N/A
SF
4.1K

230 Park Avenue
new york, NY
Price on request
Cap Rate
N/A
Price/SF
N/A
SF
34.9K
370 Park Avenue South
new york, NY
Price on request
Cap Rate
N/A
Price/SF
N/A
SF
12.8K

374 Park Avenue
new york, NY
Price on request
Cap Rate
N/A
Price/SF
N/A
SF
3.3K
399 Park Avenue
new york, NY
Price on request
Cap Rate
N/A
Price/SF
N/A
SF
8.2K