2900 Kirby Parkway
Price
Price on request
Price/Sq Ft
$22.00
Description
Ground Floor Office Space Available
Property description as provided by the listing source. PropZone adds independent market context, valuation estimates, and comparable listings.


Financial Details
Market Context
As of Q1 2026, the Memphis office market showed a 6.0% vacancy rate, average asking rents near $55.08/SF/yr, and rents up 0.4% year over year. Source: CBRE Q1 2026 market report.
Projected current pricing
indicative confidenceModeled estimate (income approach) shown as a range — not an appraisal. No market-specific cap rate is published for Memphis office yet, so this applies the typical cap rate across comparable office markets — treat it as a rough, indicative range that sharpens as sourced cap rates arrive. Projected asking rent × occupancy × net-operating-income margin band ÷ a benchmark cap rate, from Q1 2026 asking-rent data (benchmark cap rate 6.6%–8.6%, asking rent trend-adjusted to today).
Tight vacancy keeps competition for quality space elevated.
Compare it against other office listings for lease in Memphis, TN to benchmark pricing and space — view the full market.
Office market FAQ
- Is the Memphis office market tightening or softening?
- Vacancy is around 6.0% (Q1 2026).
Unified Estimate
Very Low ConfidenceRate-first confidence-weighted blend with cost-of-business adjustment.
No local comparable sales were available, so this estimate is transferred from a comparable peer market — treat it as a rough indication only. Transferred from peer market chicago (similarity: 100%) with 6 comparable listings.
Lease Rate & Market Trend
Market report quarterly trend fallback
- Avg Rent ($/SF/mo) (market data)
- Vacancy %
Investment Analysis
Beta Feature: Investment Analysis is currently in beta testing. Metrics are calculated based on available financial data and market comparables. Results are for informational purposes and should not be considered financial advice. Verify all assumptions and consult with a financial advisor before making investment decisions.
Market Employment Trend
December 2025 • Source: BLS QCEW
Economic Indicators
Source: FRED
Market Demographics
Census ACS 20242024 American Community Survey 5-Year Estimates •Released annually by U.S. Census Bureau
Rent vs. Market
$17
15.0% below market average
Listed at $17.0/sqft/mo vs. market avg $20.00/sqft/mo
Assumptions
- Market comparison: office in memphis, TN
More Office for Lease in Memphis, TN(5)
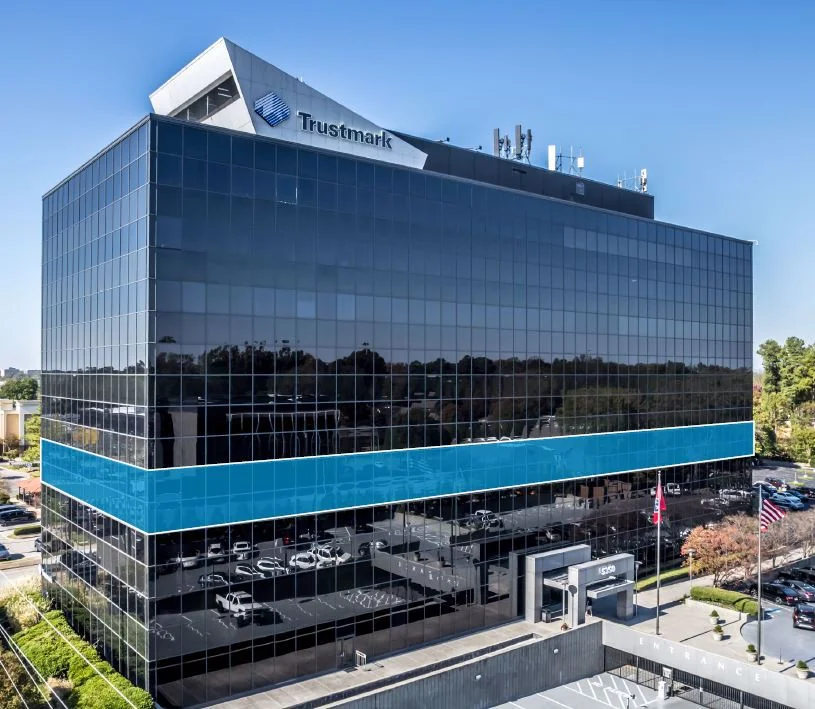
Trustmark Building
memphis, TN
Price on request
Cap Rate
N/A
Price/SF
21.0/sf
SF
N/A

44 S Front
memphis, TN
Price on request
Cap Rate
N/A
Price/SF
15.5/sf
SF
N/A

505 Tennessee Street
memphis, TN
Price on request
Cap Rate
N/A
Price/SF
18.5/sf
SF
N/A

Shelby Oaks Plaza II
memphis, TN
Price on request
Cap Rate
N/A
Price/SF
16.5/sf
SF
N/A

Pembroke Square
memphis, TN
Price on request
Cap Rate
N/A
Price/SF
18.5/sf
SF
N/A