
172 East Belt Boulevard
Price
Price on request
Market rate estimate — not broker-provided
Cost-of-Business Details
Very Low ConfidenceTransferred from peer market las-vegas (similarity: 100%) with 5 comparable listings.
| Component | Value | Detail | Source |
|---|---|---|---|
| Base Rent | $2.50/SF/mo | — | peer_city_transfer |
| Utilities | — | 9.6¢/kWh | OpenEI URDB |
| Property Tax | — | 0.0% eff. rate | API Ninjas |
| Labor Index | — | $1556/wk | BLS QCEW |
Source Provenance (1)
| Source | Type | Count | Year | Freshness | Peer |
|---|---|---|---|---|---|
| Peer City Transfer | economic_similarity | 5 | — | real-time | las-vegas (100%) |
Description
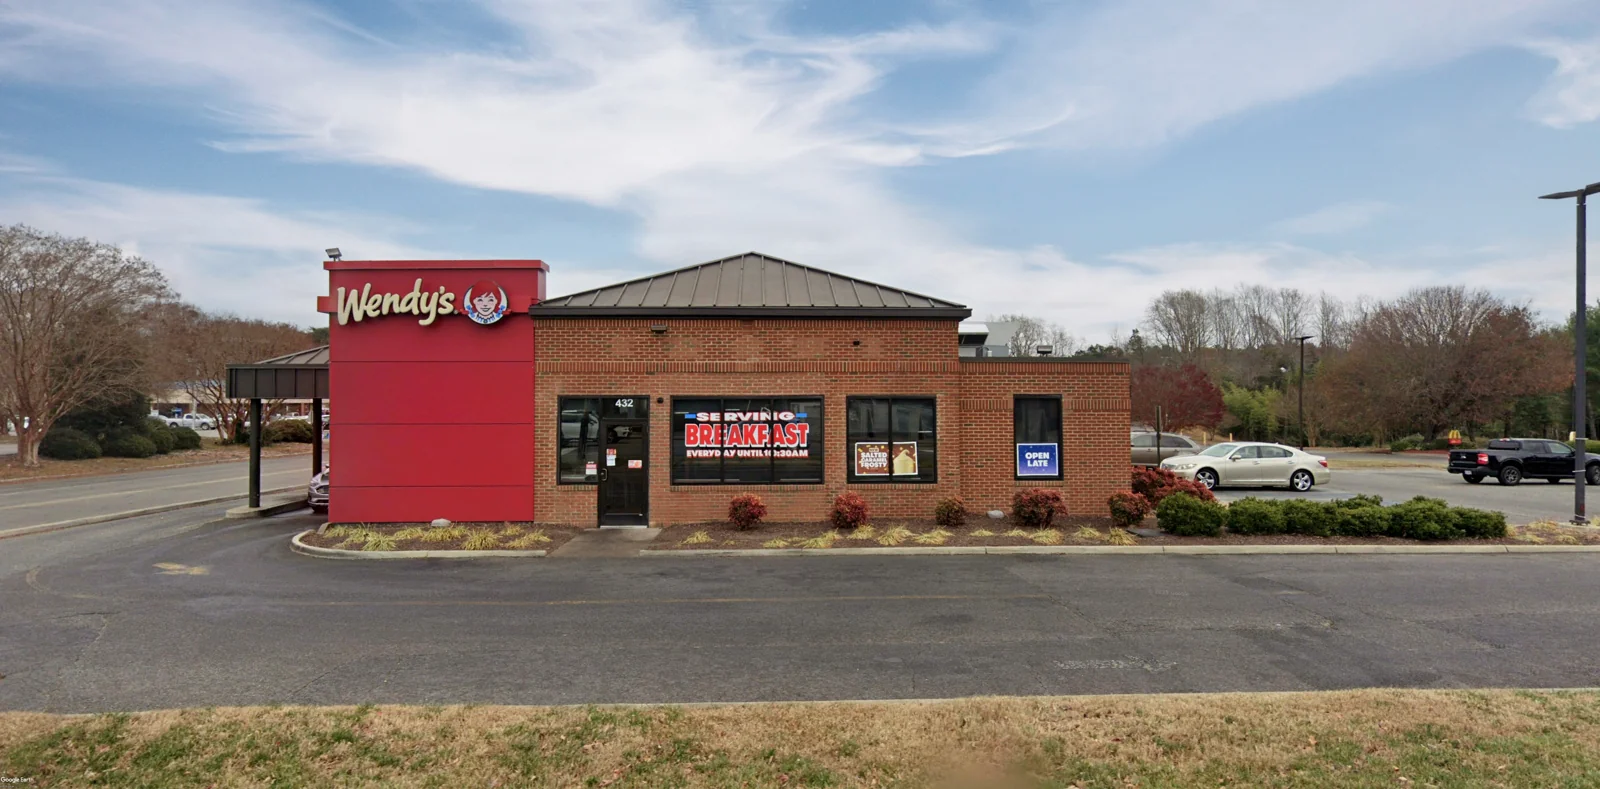
2,508 SF Wendy's for Sublease The property features a freestanding building encompassing 2,508 square feet, complete with a convenient drive-thru, situated on a 0.93-acre lot. Its prime location offers close proximity to Richmond’s Manchester District, an area of the city experiencing an explosion of multi-family development (3,500+ units under construction or delivered since 2022), and Midlothian’s major retail corridors (Midlothian Turnpike and Hull Street Road). Additionally, the site boasts excellent visibility and full-access along E Belt Boulevard, capturing 19,000 vehicles per day, making it an attractive option for any business. Currently built out as a drive-thru restaurant, the property can be reused for a myriad of retail end-users.
Property description as provided by the listing source. PropZone adds independent market context, valuation estimates, and comparable listings.


Financial Details
Market Context
As of Q1 2026, the Richmond retail market showed average asking rents near $23.93/SF/yr, and cap rates around 5.1%. Source: multiple brokerages Q1 2026 market report.
Projected current pricing
low confidenceModeled estimate (income approach) shown as a range — not an appraisal. Projected asking rent × occupancy × net-operating-income margin band ÷ market cap rate, from Q1 2026 multiple brokerages data (cap rate 5.1%, asking rent held flat).
Compare it against other retail listings for lease in Richmond, VA to benchmark pricing and space — view the full market.
Retail market FAQ
- What is the typical cap rate for retail in Richmond?
- About 5.1% as of Q1 2026, per multiple brokerages.
Unified Estimate
Very Low ConfidenceRate-first confidence-weighted blend with cost-of-business adjustment.
No local comparable sales were available, so this estimate is transferred from a comparable peer market — treat it as a rough indication only. Transferred from peer market las-vegas (similarity: 100%) with 5 comparable listings.
Lease Rate & Market Trend
Market report quarterly trend fallbackFIPS 51041
- Avg Rent ($/SF/mo) (market data)
Investment Analysis
Beta Feature: Investment Analysis is currently in beta testing. Metrics are calculated based on available financial data and market comparables. Results are for informational purposes and should not be considered financial advice. Verify all assumptions and consult with a financial advisor before making investment decisions.
Insufficient financial data for full analysis. Add more financial fields to improve metric coverage.
Market Employment Trend
December 2025 • Source: BLS QCEW
Economic Indicators
Source: FRED
Market Demographics
Census ACS 20242024 American Community Survey 5-Year Estimates •Released annually by U.S. Census Bureau
Assumptions
- Market comparison: retail in richmond, VA
More Retail for Lease in Richmond, VA(5)

6824 Hull Street Road
richmond, VA
Price on request
Cap Rate
N/A
Price/SF
36.0/sf
SF
N/A

Stonebridge Shopping Center
richmond, VA
Price on request
Cap Rate
N/A
Price/SF
36.0/sf
SF
N/A

Retail in Midlothian, VA
midlothian, VA
Price on request
Cap Rate
N/A
Price/SF
24.0/sf
SF
N/A

Property in Unknown, XX
Midlothian, VA
$3.17M
Cap Rate
N/A
Price/SF
3.0/sf
SF
N/A
Retail in Kilmarnock, VA
kilmarnock, VA
Price on request
Cap Rate
N/A
Price/SF
N/A
SF
N/A
Documents
Contact Broker

Pam Strieffler

Ian Webster
Listed by
CBRE System Import