
1320 Marsten
Price
Price on request
Square Feet
14,000


Property Details
Lease Details
Market Context
This industrial in Burlingame, CA is listed for lease across 14,000 SF. It has been on the market for 64 days.
As of Q1 2026, the San Francisco Peninsula industrial market showed a 3.8% vacancy rate, and average asking rents near $22.56/SF/yr. Source: Colliers Q1 2026 market report.
Projected current pricing
indicative confidenceModeled estimate (income approach) shown as a range — not an appraisal. No market-specific cap rate is published for San Francisco Peninsula industrial yet, so this applies the typical cap rate across comparable industrial markets — treat it as a rough, indicative range that sharpens as sourced cap rates arrive. Projected asking rent × occupancy × net-operating-income margin band ÷ a benchmark cap rate, from Q1 2026 asking-rent data (benchmark cap rate 5.5%–7.3%, asking rent held flat).
View the full San Francisco Peninsula Industrial market report →
Tight vacancy keeps competition for quality space elevated.
Compare it against other industrial listings for lease in Burlingame, CA to benchmark pricing and space — view the full market.
Industrial market FAQ
- Is the San Francisco Peninsula industrial market tightening or softening?
- Vacancy is around 3.8% (Q1 2026).
Unified Estimate
Medium ConfidenceRate estimator only; cost-of-business estimate unavailable.
Lease Rate & Market Trend
Market report quarterly trend fallbackFIPS 06081
- Avg Rent ($/SF/mo) (market data)
- Vacancy %
Investment Analysis
Beta Feature: Investment Analysis is currently in beta testing. Metrics are calculated based on available financial data and market comparables. Results are for informational purposes and should not be considered financial advice. Verify all assumptions and consult with a financial advisor before making investment decisions.
Insufficient financial data for full analysis. Add more financial fields to improve metric coverage.
Market Employment Trend
December 2025 • Source: BLS QCEW
Economic Indicators
Source: FRED
Market Demographics
Census ACS 20242024 American Community Survey 5-Year Estimates •Released annually by U.S. Census Bureau
Assumptions
- Market comparison: industrial in burlingame, CA
More Industrial for Lease in Burlingame, CA(5)
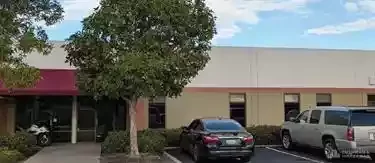
1320 Marsten
Burlingame, CA
Price on request
Cap Rate
N/A
Price/SF
N/A
SF
14.0K
23 Broderick Rd
burlingame, CA
Price on request
Cap Rate
N/A
Price/SF
N/A
SF
N/A

101 Utah Ave
s san francisco, CA
Price on request
Cap Rate
N/A
Price/SF
N/A
SF
43.2K

149-151 Linden
s san francisco, CA
Price on request
Cap Rate
N/A
Price/SF
N/A
SF
13.0K
499 Valley
brisbane, CA
Price on request
Cap Rate
N/A
Price/SF
N/A
SF
22.7K
Contact Broker
Jay Leslie
Listed by
Cushman & Wakefield